Isolation and Characterization of Extracellular Lipase-Producing Bacillus spp. and Exploratory Application of a Freeze-Dried Lipase Preparation from Phenotypically Identified Bacillus licheniformis NOS2 in Bread
食品生物技术的应用,
卷 13 编号 1 (2026),
7 十二月 2025
,
第 1-28 (e25) 页
https://doi.org/10.22037/afb.v13i1.53473
摘要
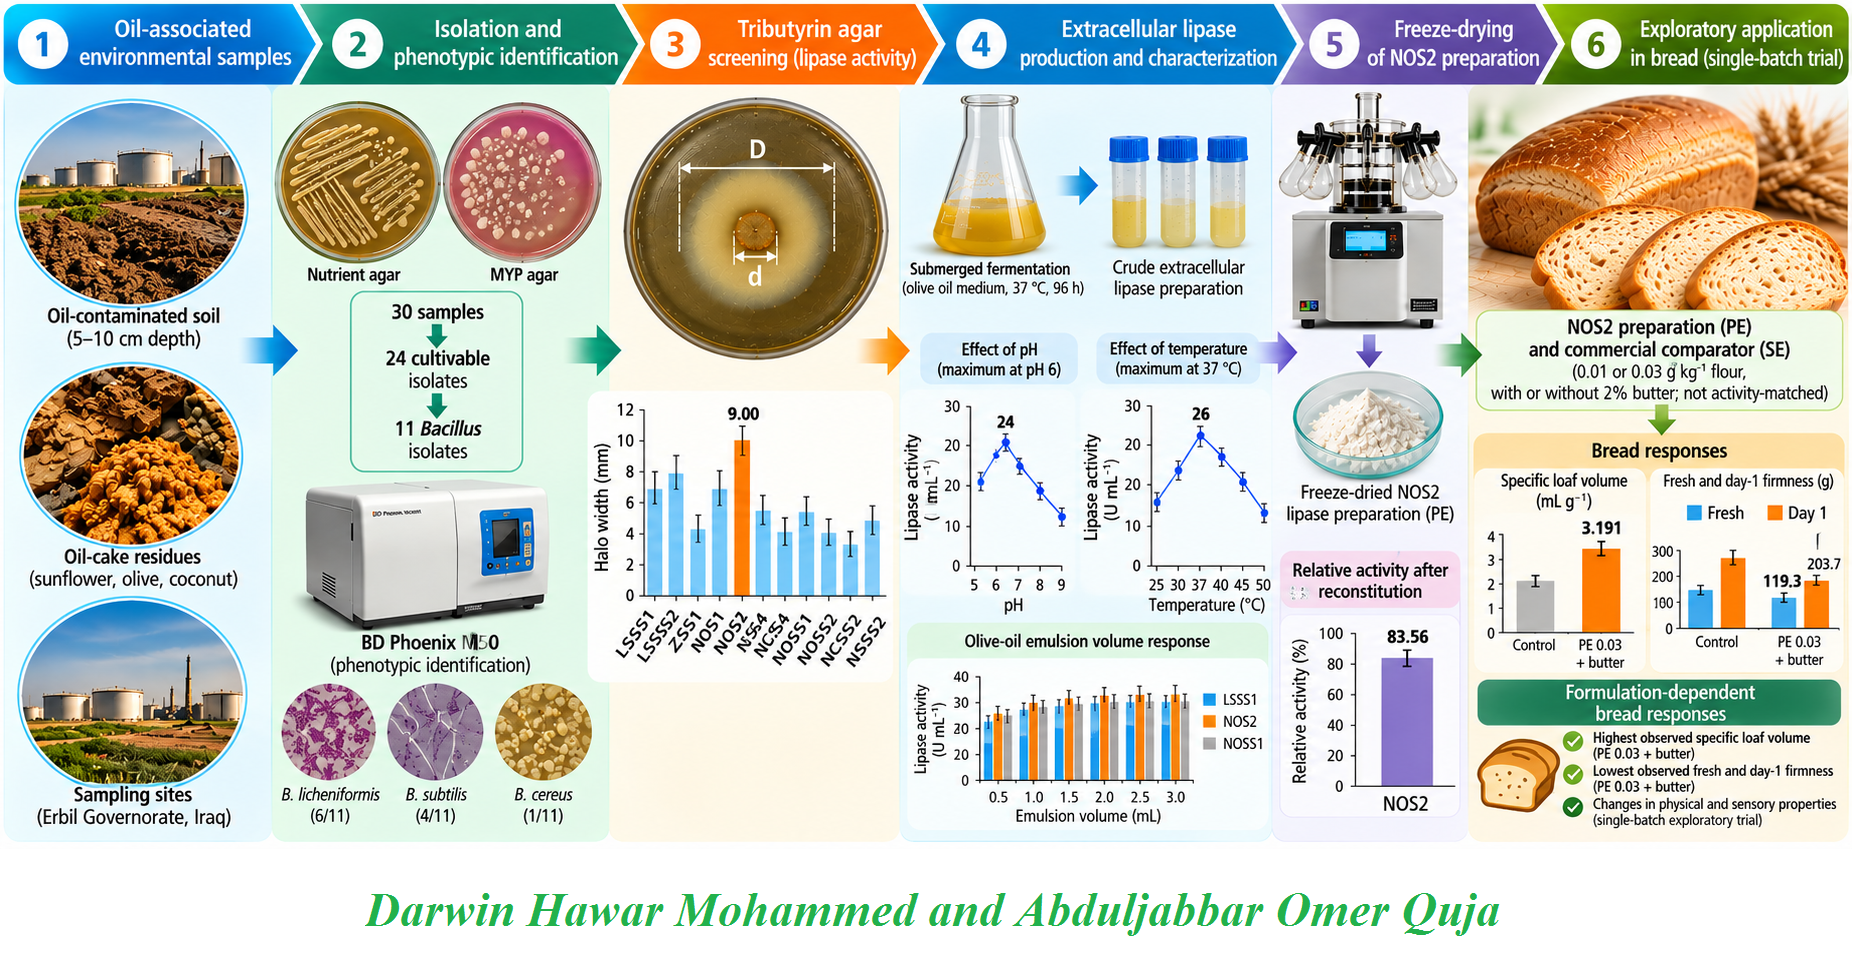
Background and Aim: Microbial lipases are established food-biotechnology catalysts; however, performance in bread depends on preparation, dose, and formulation. This study followed environmental lipolytic Bacillus isolates through phenotypic identification and quantitative enzyme selection to exploratory bread application of a freeze-dried extracellular preparation from NOS2, phenotypically identified as B. licheniformis using BD Phoenix M50 with 99% confidence.
Material and Methods: Thirty oil-associated soil and oil-cake samples were screened. Bacillus isolates were characterized conventionally and phenotypically identified using BD Phoenix M50. Tributyrin hydrolysis, submerged lipase production, protein-normalized activity, assay pH and temperature, thermal pre-exposure response, olive-oil emulsion response, ATR-FTIR, Sephadex G-100 enrichment, and freeze-drying were assessed. The freeze-dried NOS2 preparation (PE) and commercial technological comparator (SE) were added at equal powder mass (0.01 or 0.03 g kg⁻¹ flour), with or without 2% butter; they were not activity-matched. Each bread formulation was one dough batch; therefore, physical measurements were interpreted descriptively.
Results and Conclusion: Eleven isolates were phenotypically assigned to B. licheniformis (n=6), B. subtilis (n=4), or B. cereus (n=1). LSSS1, NOS2, and NOSS1 showed crude specific activities of 4.18, 3.98, and 3.31 U mg⁻¹, respectively, and highest measured immediate activity at pH 6 and 37 °C. Thermal pre-exposure resulted in a non-monotonic apparent titrimetric response in crude preparations and was not interpreted as molecular thermostability. Relative post-lyophilization activity after reconstitution was 77.42-83.56%, with NOS2 highest. In the single-batch bread trial, PE 0.03 plus butter showed the highest observed mean specific loaf volume (3.191 ± 0.033 mL g⁻¹) and lowest observed fresh and day-1 firmness (119.3 ± 11.0 and 203.7 ± 14.3 g). Sensory springiness differed among formulations after multiplicity correction, whereas overall acceptability did not show a confirmed preference hierarchy. Bread findings require independent batch replication for generalizable treatment inference.
- INTRODUCTION
Microbial lipases (EC 3.1.1.3) hydrolyze ester bonds in triacylglycerols and can catalyze esterification and transesterification under appropriate conditions. Their extracellular production by many microorganisms, broad catalytic versatility, and compatibility with diverse process environments have made them important targets for food biotechnology and other industrial applications [1]. Bacillus species are particularly relevant as extracellular-enzyme producers because of their rapid growth, secretion capacity, ecological adaptability, and long history as microbial production platforms [2,3].
Oil-contaminated soils and oil-cake residues from edible-oil processing are rational sources for lipolytic microorganisms because these environments repeatedly expose resident populations to triglycerides and lipid-derived compounds. Lipase-producing bacteria have been recovered from oil-associated environments [4,5], while oilseed cakes retain residual lipid, protein, carbohydrate, fiber, and minerals that can support microbial growth [6]. Environmental screening nevertheless has value only when plate hydrolysis is followed by quantitative enzyme production and biochemical characterization, because halo formation reflects growth, secretion, diffusion, and substrate accessibility rather than enzyme activity alone.
For food-processing use, characterization must distinguish between immediate catalytic optima and tolerance to process stresses. The pH and temperature that maximize a short assay do not necessarily predict persistence after prolonged heat exposure. This distinction is particularly important for bakery applications, where an enzyme preparation may experience changing temperature, water distribution, and substrate accessibility before it is thermally inactivated. Freeze-drying also deserves attention because it can improve handling and storage of an enzyme preparation but may cause activity losses during freezing and dehydration [14].
In breadmaking, lipase action can modify the lipid environment at gas-cell interfaces and can be associated with interactions among lipids, starch, and gluten, thereby influencing dough handling, loaf expansion, crumb structure, and firming. Recent studies have reported increases in specific volume and reductions in bread hardness under some lipase-treatment conditions, but the magnitude and direction of the response depend on enzyme origin, dose, flour lipid composition, and the presence of added fat [7,8,17,18]. These mechanisms are used here only as literature-supported explanatory frameworks. The present study did not directly quantify mono-/diacylglycerols, free fatty acids, interfacial lipid distribution, starch-lipid complex formation, or specific lipid-gluten interactions; therefore, none of these pathways is claimed as directly demonstrated in the present bread system.
Recent studies illustrate two complementary parts of the field. Environmental studies have recovered and optimized extracellular lipase production from oil-associated Bacillus isolates [4,5], whereas bakery studies commonly evaluate commercial or already-defined lipase preparations directly in bread formulations [8,17]. These approaches answer different questions. Following the same locally produced extracellular preparation from environmental recovery and quantitative selection through biochemical characterization, drying, and direct bread application can therefore provide useful source-to-application information without implying that the individual methods are themselves novel.
Accordingly, the present study is framed as an integrated source-to-application case study rather than as a claim of being the first study to combine these stages. Oil-associated Bacillus isolates were screened and ranked by quantitative extracellular lipase performance; selected preparations were characterized for immediate pH and temperature response, thermal pre-exposure response, olive-oil emulsion response, ATR-FTIR profile, partial purification, and freeze-drying; and the selected freeze-dried crude preparation was then evaluated in wheat bread at two addition levels with and without 2% butter alongside a technological commercial comparator. The objectives were to identify functional extracellular lipase producers, define the measured preparation-level biochemical behavior, and examine whether the selected preparation showed formulation-dependent patterns in bread quality under the stated exploratory design.
- MATERIALS AND METHODS
2.1. Environmental Sampling and Isolation
Environmental sampling was conducted in June 2024 in Erbil Governorate, Kurdistan Region, Iraq. Samples were obtained from Zer Oil Factory in Erbil, Srushti Nwebunawa Oil Factory in Bnaslawa/Erbil, and a local family-operated oil-processing business in Qushtapa. Thirty separately collected specimens comprising oil-contaminated soils and oil-cake residues associated with sunflower, olive, and coconut processing were obtained by purposive sampling. Soil was sampled aseptically at approximately 5-10 cm depth; approximately 50 g of material was placed in sterile containers, transported to the laboratory on the same day, and processed after approximately 24 h at room temperature. Twenty-four specimens yielded bacterial growth under the isolation conditions and were retained for isolate-level testing. In the laboratory coding system, labels without the suffix “S” denote soil samples, whereas labels containing the suffix “S” denote substrate/oil-cake samples. The complete 24-record isolate-level dataset is provided in Table 10.
For heat-selective enrichment, 2 g of each sample was added to 10 mL sterile nutrient broth and heated at 90 °C for 10-12 min. This step was intentionally selective for heat-tolerant and/or spore-forming organisms and could exclude heat-sensitive or non-spore-forming lipase producers; consequently, the recovered isolates should not be interpreted as representing the full microbial diversity of the source environments. Enrichment cultures were incubated at 37 °C for 24-48 h and streaked onto nutrient agar (LAB, Lab M Limited, UK). Plates were incubated aerobically at 37 °C for approximately 24 h, and morphologically distinct colonies were repeatedly re-streaked until pure. Routine cultures were maintained on nutrient-agar slants at 4 °C; long-term stocks were prepared in nutrient broth containing 30% glycerol and stored at -20 and -80 °C.
2.2. Phenotypic Characterization and Identification
Purified isolates were examined by Gram staining and endospore staining. Motility, catalase, oxidase, citrate utilization, urease activity, indole production, and hemolysis on 5% sheep-blood agar were evaluated using conventional procedures. Mannitol Egg Yolk Polymyxin (MYP) agar (Ibresco, Italy) was used as an additional differential medium after cooling the basal medium to approximately 45-50 °C before addition of egg-yolk and selective supplements. Colony color, mannitol-related reactions, and egg-yolk precipitation were treated as supporting characteristics rather than definitive species criteria.
Selected Bacillus isolates were subjected to automated phenotypic identification using the BD Phoenix M50 system (BD, USA) with PMIC/ID-111 Gram-positive panels. Fresh pure growth was adjusted to approximately 0.5 McFarland before panel inoculation. Instrument-generated species assignments were interpreted as phenotypic identifications and were considered together with microscopic, cultural, and conventional biochemical characteristics. Phoenix confidence values for the 11 target isolates ranged from 90% to 99%; NOS2, subsequently used for the bread preparation, was identified phenotypically as Bacillus licheniformis with 99% confidence. Sequence-based confirmation was not performed because the microbiological stage was designed for functional isolate selection rather than taxonomic or phylogenetic investigation. The manuscript therefore does not claim molecular confirmation. Detailed BD Phoenix identification and summarized reaction-profile data are provided in Tables 11A-11C.
2.3. Tributyrin Screening
The 11 isolates phenotypically assigned to the target Bacillus species were screened on tributyrin agar at approximately 37 °C for 24-48 h. The retained halo dataset represents individual preliminary plate-screening observations rather than means of independently replicated plates, and inoculum cell density was not quantitatively standardized for this screening step. The total clear-zone diameter including the colony (D) and colony diameter (d) were measured in millimeters. Hydrolysis index was calculated as HI = D/d, total hydrolyzed region excluding the colony as H = D - d, and one-sided halo width as W = (D - d)/2. Tributyrin agar was therefore used as a descriptive first-stage functional screen rather than as the sole isolate-selection criterion; subsequent quantitative volumetric and protein-normalized activities determined shortlist selection.
2.4. Inoculum, Submerged Production, and Crude-Enzyme Recovery
A single colony was inoculated into 10 mL olive-oil broth in a 250-mL conical flask and incubated at 37 °C for 24 h at 240 rpm using a Stuart SI600C orbital incubator (Stuart Equipment, UK). The 24-h production inoculum was not standardized by optical density, viable cell count, or McFarland value before transfer; therefore, this step is acknowledged as a potential source of between-isolate production variability. Five milliliters of this inoculum was transferred to 100 mL production medium in a 500-mL conical flask. The medium contained, per 100 mL, peptone 2.0 g, glucose 2.0 g, KH2PO4 0.5 g, (NH4)2SO4 0.1 g, (NH4)2CO3 0.1 g, MgSO4 0.1 g, and olive oil 1.0 mL. Cultures were incubated at 37 °C for 96 h at 100 rpm using the same orbital incubator. The production culture was centrifuged at 10,000 rpm for 30 min at 4 °C using a NÜVE refrigerated centrifuge (NÜVE, Türkiye). After centrifugation, only the aqueous phase was carefully collected as the crude extracellular enzyme preparation, while the visible oil-rich upper phase and the sedimented pellet were avoided.
2.5. Titrimetric Lipase Assay and Protein Determination
The substrate emulsion contained 1.5 mL distilled water, 1.5 mL olive oil, and 0.34 g gum Arabic mixed for 1 min at room temperature. The routine assay combined this emulsion with 4 mL 50 mM sodium phosphate buffer (pH 6.5) and 1 mL enzyme preparation. Reactions were incubated at 35 °C for 15 min and stopped with 10 mL acetone/ethanol/distilled water (1:1:1, v/v/v). Released fatty acids were titrated with 0.05 M NaOH using a Metrohm Titrino 794 automatic titrator (Metrohm AG, Switzerland). The corresponding blank contained the same substrate-emulsion and buffer components, with enzyme added only immediately before titration; thus, the blank corrected background titratable acidity and non-incubated enzyme/substrate contributions. No additional enzyme-only blank was used. One unit (U) was defined as 1 µmol fatty acid released per minute. Activity was calculated as Activity (U mL⁻¹) = [(Vs - Vb) × MNaOH × 1000]/(t × Ve), where Vs and Vb are the sample and blank NaOH volumes (mL), MNaOH = 0.05 mol L⁻¹, t = 15 min, and Ve = 1.0 mL enzyme preparation. Under these fixed conditions, Activity = (Vs - Vb) × 3.33 U mL⁻¹. No additional dilution factor was applied.
Protein concentration was determined by the Lowry method using bovine serum albumin as the calibration standard. Samples were adjusted to a 1.0-mL pre-reagent volume, mixed with 2.5 mL fresh analytical reagent for 10 min, then with 0.5 mL diluted Folin reagent for 30 min at room temperature. Absorbance was read at 720 nm using a Beckman Coulter DU 800 spectrophotometer (Beckman Coulter, USA). Specific activity was expressed as U mg⁻¹ protein.
2.6. Selection and Biochemical Characterization of Extracellular Preparations
The three crude preparations with the highest protein-normalized activities were selected: LSSS1 and NOS2, phenotypically identified as B. licheniformis, and NOSS1, phenotypically identified as B. subtilis, by BD Phoenix M50 (BD, USA). The effect of pH on catalytic activity was evaluated at pH 5, 6, 7, 8, and 9. A 50 mM acetate buffer was used at pH 5. For pH 6-9, 50 mM sodium phosphate buffers prepared from NaH₂PO₄·H₂O and Na₂HPO₄ in appropriate proportions were used. For each determination, the olive-oil emulsion was combined with 4 mL of the designated buffer and 1 mL crude enzyme preparation. Reactions were incubated at 35 °C for 15 min and subsequently stopped and titrated as described for the routine assay. No enzyme pre-incubation at the test pH values was performed; consequently, this experiment measured the immediate effect of assay pH on catalytic activity rather than pH stability. Although pH 6.5 was used for the routine assay, the characterization experiment identified pH 6 as the maximum-activity assay pH for all three selected preparations.
For reaction-temperature characterization, the same titrimetric assay was conducted at 25, 30, 37, 40, 45, and 50 °C using a Stuart SI600C orbital incubator (Stuart Equipment, UK). At each temperature, the reaction mixture was incubated for 15 min with shaking while the remaining assay components were maintained unchanged. The reaction was then stopped and titrated as described for the routine assay. This experiment measured the immediate effect of reaction temperature on catalytic activity and was distinct from the thermal pre-exposure experiment. For thermal pre-exposure, aliquots of the crude aqueous preparations were held at 30, 40, 50, 60, 70, and 80 °C for 30, 60, 90, 120, and 150 min and were then assayed titrimetrically. The retained laboratory records include triplicate blank-corrected titration differences (Vs - Vb) for each condition. The preparations were not dialyzed or desalted, and no separate autoclaved or otherwise deliberately heat-inactivated preparation control was included at each temperature. Accordingly, this experiment characterizes the empirical titrimetric response of the crude preparation after thermal pre-exposure; it was not designed to establish intrinsic molecular thermostability or heat activation.
The effect of olive-oil emulsion level was evaluated by adding 0.5, 1.0, 1.5, 2.0, 2.5, or 3.0 mL of the prepared emulsion while keeping 4.0 mL buffer and 1.0 mL enzyme preparation constant. The corresponding nominal liquid reaction volumes before stop solution were therefore 5.5, 6.0, 6.5, 7.0, 7.5, and 8.0 mL. Because the emulsion was prepared from 1.5 mL olive oil, 1.5 mL water, and 0.34 g gum Arabic, the nominal olive-oil loadings were approximately 0.25, 0.50, 0.75, 1.00, 1.25, and 1.50 mL per reaction, assuming representative aliquoting of the emulsion. Olive oil is a heterogeneous triacylglycerol mixture supplied as a gum-Arabic emulsion, so a single molar substrate concentration was not assigned. Total reaction volume was not held constant and no normalization to total reaction volume was applied; activity remained expressed per milliliter of the fixed 1.0-mL enzyme aliquot. Accordingly, the experiment is interpreted only as an empirical emulsion-volume response and not as conventional substrate-concentration kinetics. Individual maxima were identified from the measured responses, and the 2.0-mL level gave the highest combined mean activity across the three preparations.
2.7. ATR-FTIR Characterization and Sephadex G-100 Partial Purification
ATR-FTIR spectra of LSSS1, NOS2, and NOSS1 crude aqueous extracellular preparations were compared with a lipase reference using a Shimadzu IRAffinity-1 spectrometer (Shimadzu, Japan) equipped with a PIKE Technologies MIRacle Universal ATR accessory (PIKE Technologies, USA). Spectra were acquired from 4000 to 400 cm⁻¹ at 4 cm⁻¹ resolution using 30 scans and Happ-Genzel apodization. Because the samples were crude aqueous matrices, spectral similarities were treated as complementary functional-group evidence rather than proof of lipase purity or identity.
For partial purification, 20 g dry Sephadex G-100 was hydrated in 500 mL distilled water, heated at approximately 85-90 °C for 5 h, and kept at 4 °C overnight. The gel was packed in a 2.0 × 70 cm column and equilibrated with 0.1 M potassium phosphate buffer at pH 6.0 containing 0.02% sodium azide. Two milliliters of fresh crude preparation was loaded directly. Sixty 2-mL fractions were collected at approximately 6 min per fraction. Protein-containing regions were monitored at 280 nm, lipase activity was assayed titrimetrically, active fractions were pooled, and protein was determined by Lowry. The products are described as partially purified fractions, not homogeneous lipases.
2.8. Freeze-drying and Selection of the Bread Preparation
Crude extracellular preparations were freeze-dried individually using a BIOBASE BK-FD10P freeze dryer (BIOBASE, China) for approximately 51-52 h. Five hundred milliliters of each crude supernatant was lyophilized, and the dry material was weighed and stored at approximately 4 °C. Activity was measured before freeze-drying and after reconstitution of the dried material using the same titrimetric assay. Relative post-lyophilization activity was calculated as (post-freeze U mL⁻¹/pre-freeze U mL⁻¹) × 100. Because the comparison was not normalized to total catalytic units or to total recovered dry mass, this percentage is not interpreted as total enzyme recovery. The freeze-dried crude NOS2 extracellular preparation, not the Sephadex G-100 fraction, was used in bread and is designated PE.
2.9. Bread-Application Design
PE was evaluated alongside a technological commercial lipase comparator (SE; Immobilized Lipase 7, IMMAULI-ADS_11, Forever brand, Nanjing Forever Pharmacy Co., Ltd., Nanjing, China; manufacturer-declared activity >2,000 TBU g⁻¹; storage 2-8 °C). The comparison was deliberately performed at equal added powder mass (0.01 or 0.03 g kg⁻¹ flour) to evaluate preparation-level technological behavior at the same formulation inclusion rate. It was not designed as an activity-normalized comparison of catalytic potency. The manufacturer-declared TBU g⁻¹ value for SE was not converted to the activity units generated by the olive-oil titrimetric assay used for PE because the values derive from different assay systems. Thus, side-by-side formulation results are retained as part of the experimental design, but they are not interpreted as evidence that one preparation has greater intrinsic enzymatic efficiency than the other. Each preparation was tested with or without 20 g kg⁻¹ flour (2%) butter; untreated and butter-only controls completed the 10 formulations (Table 4). Each formulation was produced as one dough batch. Loaves from the same batch and repeated positions within a loaf were treated as subsamples or technical/spatial observations, not independent treatment replicates.
2.10. Breadmaking and Specific Loaf Volume
Flour, salt, sugar, instant dry yeast, and the assigned enzyme preparation were dry-mixed for 1-2 min; butter was incorporated in the 2% butter formulations. Water addition was 600 mL kg⁻¹ flour without butter and 590 mL kg⁻¹ flour with butter. Total water was therefore not matched between butter and non-butter formulations; the 10 mL kg⁻¹ difference was part of the original formulation protocol and is treated as a potential formulation confounder when butter-containing and non-butter treatments are compared. Dough was mixed for 10 min at 60 rpm using a Kenwood KHH01.000SI mixer (Kenwood Limited, UK) fitted with a dough hook, bulk-fermented for 120 min at 27 °C, punched down, and rested covered for 15 min at 27 °C. Dough was divided into 250-g pieces, rounded, sheeted, rolled, and placed in uniform metal loaf pans (138 × 67 × 52 mm). Final proofing was conducted for 30 min at 35 °C and 85% relative humidity, followed by baking at 200 °C for 25 min in a preheated Mekappa OWA15X-A4M convection oven (Mekappa, Türkiye). Loaves were depanned and cooled on wire racks for at least 1 h.
Loaf volume was measured in five selected loaves per formulation using chia-seed displacement. An uncompressed starting volume of 1000 mL chia seed was placed in a 1000-mL graduated beaker, and displaced seed was collected and read volumetrically. Specific loaf volume (SLV) was calculated as loaf volume (mL)/cooled loaf mass (g) and expressed as mL g⁻¹. Mean ± sample SD describes within-batch loaf variation.
2.11. Crumb Firmness and Storage
Bread samples were stored in sealed polyethylene zip bags at approximately 25 °C and evaluated on days 0, 1, 3, 5, and 7. At each assigned time point, a 2.0-cm-thick central slice from the stored sample was cut and tested immediately. The retained dataset contains three non-overlapping firmness measurements from the central crumb at each time point; these are technical/spatial readings and are not independent breadmaking replicates or independent treatment batches. Crumb firmness was measured with a STEVENS-LFRA Texture Analyser (Mechtric Stevens, UK) in NORMAL mode using a TA3 cylindrical probe (25.4 mm diameter), a test speed of 1 mm s⁻¹, and a compression distance of 10 mm. The load was zeroed before determination and recorded in grams, with crust avoided during measurement.
Firmness development was additionally summarized with the empirical expression Ft = F∞ - (F∞ - F0) exp(-kt^n). For treatment comparison, n was fixed at 1 and k was expressed in day⁻¹. Because only five storage times were available and the largest change frequently occurred between days 0 and 1, k was interpreted only as a descriptive apparent firming index, not as a direct measure of starch crystallization or retrogradation kinetics.
2.12. Instrumental Crust and Crumb Color
Fresh-bread crust and crumb color were measured using a 3NH NR110 Precision Colorimeter (Shenzhen ThreeNH Technology Co., Ltd., China) after calibration against a standard white reference. CIE L*a*b* coordinates were recorded under D65 illumination using a CIE 10° observer, 45/0 geometry, and a 20-mm aperture. Three non-overlapping sites were measured on the crust and three on the crumb of each tested loaf and averaged at loaf level. Total color difference relative to the untreated control was calculated by CIE76: ΔE*ab = [(ΔL*)2 + (Δa*)2 + (Δb*)2]1/2. Color was a fresh-bread endpoint and was not monitored during the 7-day storage period.
2.13. Sensory Evaluation and Ethical Considerations
Twelve trained panelists evaluated the 10 bread formulations on day 1 after baking in a single repeated-measures session. Before formal evaluation, the panelists received a specific orientation/training session covering the definitions and interpretation of the nine attributes—crust color, crumb color, aroma, springiness, crumb softness, rancidity, flavor, aftertaste, and overall acceptability—and use of the 10-point categorical scale. Individual panelist performance was assessed during the training stage before the final evaluation. Whole bread slices were identified with randomized three-digit codes and presented in randomized order; water was provided for palate cleansing. For rancidity, higher values represented less perceived rancidity. The sensory component was conducted under the human-research approval held for the bread study from the Human Research Ethics Committees (HRECs), Research Centre, Salahaddin University-Erbil (Reference No. SU2026HREC/70B; approved 22 February 2026), and written informed consent was obtained from participants.
2.14. Statistical Analysis and Interpretation
Routine lipase-activity measurements were conducted in duplicate unless otherwise specified; the olive-oil emulsion experiment was based on triplicate titration records. Enzyme-characterization results are reported as measured values or means as appropriate. For sensory data, the same 12 panelists rated all 10 formulations, so panelists served as repeated-measures blocks and each panelist contributed one rating per formulation for each attribute. The outcomes were ordinal/categorical scores, all panelists evaluated all formulations, and tied ratings were retained and handled within the rank-based Friedman procedure. Friedman repeated-measures tests were used for omnibus formulation comparisons, with Kendall's W reported as an effect-size measure. Holm correction was applied across the nine omnibus attribute tests. Planned paired control-versus-treatment comparisons were evaluated with Wilcoxon signed-rank tests and Holm adjustment. No exhaustive all-pairs analysis among every non-control formulation pair was used; accordingly, no unsupported pairwise claims among non-control formulations are made.
For bread physical measurements, the experimental unit for a treatment was the dough batch. Because only one batch was produced per formulation, loaf-level specific loaf volume values and within-slice firmness positions do not constitute independent treatment replication. Exploratory ANOVA output generated from these subsample/technical observations was therefore not used as confirmatory evidence of treatment-level significance. Specific loaf volume, firmness, apparent firming-index, and color comparisons are presented descriptively with appropriate sample SDs or spatial variation. Percentage differences from the untreated control are likewise descriptive measures of the observed within-batch magnitude and are not interpreted as independently replicated treatment effects. This distinction was maintained throughout interpretation to avoid pseudoreplication.
- RESULTS AND DISCUSSION
3.1. Isolation and Phenotypic Identification
Twenty-four cultivable bacterial isolates were recovered from the 30 environmental samples, and 11 received species assignments by BD Phoenix M50 phenotypic identification. Six isolates (LSSS1, LSSS2, NSS4, NOS1, NOS2, and NSSS2) were identified phenotypically as Bacillus licheniformis, four (ZSS1, NCS4, NOSS1, and NOSS2) as Bacillus subtilis, and one (NCSS2) as Bacillus cereus. Phoenix confidence values ranged from 90% to 99%. NOS2, the isolate subsequently selected for bread application, was phenotypically identified as Bacillus licheniformis with 99% confidence. These assignments were not independently confirmed by sequencing and are not presented as molecular taxonomic identifications. Recovery of lipolytic Bacillus from oil-associated matrices agrees with reports that lipid-contaminated soils and oil-processing residues can enrich microorganisms capable of extracellular lipid hydrolysis [4,5]. Representative Gram/endospore microscopy and MYP agar phenotypes are presented in Figures 11 and 12.
3.2. Tributyrin Hydrolysis and Quantitative Extracellular Lipase Production
All 11 target isolates produced visible tributyrin hydrolysis. NOS2 produced a 30-mm total clear-zone diameter with a 12-mm colony, giving HI = 2.50 and the largest one-sided halo width (9.00 mm) (Figure 1). ZSS1 also had HI = 2.50 but a markedly smaller one-sided halo (4.50 mm), illustrating that an index and an absolute halo dimension rank plate behavior differently. LSSS2 and LSSS1 produced halo widths of 8.00 and 7.50 mm, respectively. These results support tributyrin agar as a useful screen but not as a stand-alone selection tool. Additional representative tributyrin-screening plates are presented in Figure 13.
Submerged fermentation changed the ranking. LSSS1 showed the highest crude volumetric activity (25.89 U mL⁻¹), followed by NOSS1 (25.33 U mL⁻¹) and NOS2 (24.33 U mL⁻¹). On a protein basis, LSSS1, NOS2, and NOSS1 had the highest specific activities at 4.18, 3.98, and 3.31 U mg⁻¹ and were selected for detailed characterization. The mismatch between plate halo ranking and liquid-culture specific activity is consistent with the fact that tributyrin plates integrate colony growth, secretion, diffusion, and substrate accessibility, whereas submerged assays quantify catalytic activity accumulated in the extracellular liquid phase. Similar two-stage approaches are used in studies of lipolytic Bacillus from contaminated soils [4,5]. Thus, the present data argue against treating a large hydrolysis halo as a quantitative proxy for final enzyme productivity; in this dataset, NOS2 had the widest one-sided halo, whereas LSSS1 ultimately led the protein-normalized crude activity ranking.
3.3. Assay pH and Reaction Temperature
All three selected preparations showed their highest measured activity at pH 6 (Figure 2A): 23.00 U mL⁻¹ for LSSS1, 24.00 U mL⁻¹ for NOS2, and 26.00 U mL⁻¹ for NOSS1. Activities declined at pH 7-8 and showed a small increase at pH 9, but none exceeded the pH-6 value. Because no pre-incubation at the test pH was performed, these data describe immediate pH-dependent catalytic activity rather than pH stability. The pH-6 maximum agrees with the partially purified B. cereus ATA179 lipase reported by Demirkan et al. [11], which also showed an optimum at pH 6. In contrast, the recombinant B. licheniformis IBRL-CHS2 lipase characterized by Almansoori et al. [12] showed optimum activity at pH 7. This difference is not contradictory in a methodological sense: strain background, purification state, buffer system, substrate, and activity assay can shift the apparent pH optimum. The agreement among all three crude preparations in the present work is therefore most useful as an internally consistent working condition, not as a species-wide property of Bacillus lipases. The complete pH-response dataset is provided in Table 13A.
Reaction-temperature profiles were similarly compact. LSSS1, NOS2, and NOSS1 reached maxima of 26.00, 26.00, and 27.00 U mL⁻¹ at 37 °C, respectively, while activities across 25-50 °C remained within 23.00-27.00 U mL⁻¹. The temperature maximum is close to the 35 °C optimum reported for recombinant B. licheniformis IBRL-CHS2 lipase [12], but lower than the 55 °C optimum reported for the partially purified B. cereus ATA179 enzyme [11]. Such between-study variation is expected because lipases from different Bacillus strains can differ substantially in sequence, purification state, substrate preference, and assay format. The comparatively broad activity plateau in the present crude preparations may be technologically more informative than the single-point maximum because it indicates measurable catalytic performance across temperatures relevant to dough preparation and early process heating. The complete reaction-temperature dataset is provided in Table 13B.
3.4. Apparent Lipolytic Activity After Thermal Pre-Exposure
The crude aqueous extracellular preparations yielded measurable titrimetric lipolytic responses after thermal pre-exposure (Figure 3). At 80 °C for 120 min, the calculated apparent activities were 30.00 U mL⁻¹ for LSSS1, 30.00 U mL⁻¹ for NOS2, and 32.00 U mL⁻¹ for NOSS1. The response was non-monotonic, with some high-temperature/time combinations giving values equal to or greater than those measured after lower-temperature exposure. The full triplicate blank-corrected titration records (Vs - Vb) are provided in Tables 12D-12F. These observations remain valid as empirical responses of the crude preparation under the stated assay conditions, but they should not be assigned uniquely to the lipase molecule. The aqueous phase had been separated from the visible oil-rich layer and pellet by refrigerated centrifugation, and the routine assay was blank-corrected; nevertheless, the preparation was neither dialyzed/desalted nor tested against an independently heat-inactivated matrix control. Residual dissolved or finely dispersed lipid-derived/titratable components and temperature-dependent changes in the crude matrix therefore cannot be excluded. The result is consequently reported as apparent titrimetric lipolytic activity after thermal pre-exposure rather than as proof of molecular thermostability or heat activation. Complete thermal pre-exposure activity matrices are provided in Tables 12A-12C, with the corresponding triplicate blank-corrected titration differences in Tables 12D-12F.
The distinction between immediate reaction-temperature behavior and thermal pre-exposure response is important. The former describes catalytic activity during a 15-min assay at the test temperature, whereas the latter describes the response measured after prior exposure of the crude preparation to heat. Cross-study comparisons of thermal behavior must also be interpreted cautiously because enzyme purity, substrate, buffer, exposure protocol, assay format, and residual-activity calculation differ substantially among studies. Therefore, no intrinsic biological superiority is inferred from between-study differences. The additional controls requested by the reviewer would provide greater mechanistic resolution; in their absence, the present data are restricted to the observed preparation-level response.
3.5. Olive-Oil Emulsion Response
The three preparations responded differently to increasing olive-oil emulsion volume. LSSS1 reached its highest measured activity (28.00 U mL⁻¹) at 1.5 mL. NOS2 reached 29.00 U mL⁻¹ at 1.0, 2.0, and 3.0 mL, while NOSS1 reached 29.00 U mL⁻¹ at 2.0 mL. Across preparations, 2.0 mL gave the highest combined mean activity (28.33 U mL⁻¹) and was selected as the most favorable common working level (Figure 4). Because both substrate amount and total reaction volume changed across the tested conditions, and no reaction-volume normalization was applied, these measurements are interpreted only as empirical emulsion-volume responses. They are not used for Michaelis-Menten or conventional concentration-kinetic interpretation. The complete emulsion-response dataset is provided in Table 13C.
3.6. ATR-FTIR and Sephadex G-100 Enrichment
ATR-FTIR spectra of the crude preparations shared features in protein-compatible regions, including bands around 3273-3330 cm⁻¹ and 1631-1641 cm⁻¹. The latter region overlaps both the protein amide-I range and the bending mode of water, which is important because the bacterial samples were crude aqueous preparations. Several bands prominent in the lipase reference were not reproduced with the same prominence in all crude samples. FTIR therefore supports the protein-containing nature and functional-group profile of the preparations but cannot independently establish lipase identity or purity.
Sephadex G-100 gel filtration increased specific activity from 4.18 to 12.93 U mg⁻¹ for LSSS1 (3.09-fold), from 3.98 to 10.96 U mg⁻¹ for NOS2 (2.75-fold), and from 3.31 to 16.16 U mg⁻¹ for NOSS1 (4.88-fold). NOSS1 therefore showed the greatest enrichment. Apparent activity recoveries exceeded 100%, a result that can occur when partial purification removes inhibitory material or when protein and activity assays respond differently to the changing sample matrix. The enrichment is modest compared with highly purified recombinant or multistep-purified Bacillus lipases [12,13], but that contrast is expected because the present objective was partial enrichment rather than isolation of a homogeneous enzyme. The practical downstream choice was also deliberately different: bread trials used the freeze-dried crude NOS2 preparation rather than the Sephadex fraction, thereby testing a preparation closer to a scalable food-processing ingredient.
3.7. Freeze-Drying and Selection of PE
Freeze-drying converted 500 mL of crude supernatant into 14.40 g dry material for LSSS1, 18.53 g for NOS2, and 15.66 g for NOSS1. These masses represent total crude solids rather than purified lipase. Pre-freeze activities were 24.11, 24.33, and 24.22 U mL⁻¹, and reconstituted post-freeze activities were 18.67, 20.33, and 19.33 U mL⁻¹, corresponding to relative post-lyophilization activities of 77.42%, 83.56%, and 79.82%, respectively (Figure 5). NOS2 was selected pragmatically for the downstream bread application rather than through a prespecified composite score: among the three shortlisted preparations, it had high crude specific activity (3.98 U mg⁻¹; second among the three), the highest relative post-lyophilization activity, and the greatest recovered dry mass. This choice is therefore presented as a practical downstream selection rather than proof that NOS2 was intrinsically the best lipase producer. Because the percentage calculation was based on post-/pre-freeze U mL⁻¹ after reconstitution and was not normalized to total catalytic units or recovered dry mass, it is not interpreted as absolute enzyme recovery. The complete freeze-drying mass and activity dataset is provided in Table 14.
3.8. Specific Loaf Volume: Formulation-Dependent Response
The bread application examined whether upstream biochemical selection was accompanied by an observable food-quality response. The untreated control had a mean SLV of 2.207 ± 0.028 mL g⁻¹. Without butter, PE 0.01 showed 2.679 ± 0.089 mL g⁻¹ and PE 0.03 showed 2.541 ± 0.069 mL g⁻¹; thus, the lower PE addition level had the larger observed mean SLV in the non-butter formulation. With 2% butter, PE 0.03 showed an observed mean SLV of 3.191 ± 0.033 mL g⁻¹ in the single-batch trial (Table 5; Figure 6). The SE formulations remain reported in Table 5 solely as formulation-context reference conditions because PE and SE were not activity-matched; no PE-versus-SE performance inference is made. The observed mean for PE 0.03 plus butter was 44.60% higher than that of the untreated control within this single-batch comparison. This percentage describes within-batch magnitude only and is not an independently replicated treatment effect. Butter-containing and non-butter formulations also differed by 10 mL kg⁻¹ flour, so contrasts involving butter cannot be attributed to fat addition alone. Representative external and crumb photographs are shown in Figure 7.
The reversal in the observed PE dose ranking is more informative than a simple assumption that increasing lipase addition necessarily increases loaf volume. Recent bread studies report that lipase supplementation can increase specific volume and reduce hardness [8,17,18]. Yin et al. [8] observed larger specific volume and lower hardness in enzyme-treated toast, including a lipase treatment, while Santos et al. [17] showed that the response to commercial lipase depended on the enzyme and concentration tested. The present descriptive data are compatible with formulation-dependent responses reported in those studies, but the single-batch design does not establish statistical superiority among formulations. The formulation dependence is also compatible with literature describing effects of native and added lipids and lipase-generated surface-active products on gas-cell interfaces and crumb structure [7,9]. However, monoacylglycerols, diacylglycerols, free fatty acids, and individual lipid classes were not quantified in the present dough or bread samples. Therefore, lipid-mediated effects remain a literature-supported mechanistic framework rather than a pathway demonstrated directly in this study.
The exploratory one-way ANOVA generated from the five loaf observations per treatment showed strong between-group separation, but those loaves originated from a single dough batch for each formulation. They are therefore subsamples, and the inferential p-values are not used as evidence of independently replicated treatment effects. Independent baking batches would be required to establish statistical superiority of one formulation over another.
3.9. Crumb Firmness During Storage
Firmness increased in every formulation during storage, with the greatest numerical separation from the untreated control occurring in fresh and day-1 bread (Table 6; Figure 8). Fresh control firmness was 170.7 ± 11.5 g. PE 0.01 and PE 0.03 showed observed fresh-firmness values of 131.3 ± 13.7 and 131.0 ± 29.3 g, respectively, while PE 0.03 plus butter showed 119.3 ± 11.0 g. On day 1, the control reached 330.3 ± 3.5 g and PE 0.03 plus butter showed 203.7 ± 14.3 g. The separation then narrowed: PE 0.03 plus butter measured 323.7 ± 4.0, 327.3 ± 1.2, and 330.7 ± 2.3 g on days 3, 5, and 7, while the control measured 333.0 ± 1.7, 340.3 ± 3.8, and 347.3 ± 6.4 g. SE firmness data are retained in the corresponding table as formulation-context reference values and are not used for PE-versus-SE performance claims.
Accordingly, the most defensible storage-quality interpretation is that PE 0.03 plus butter was associated descriptively with greater softness during the early storage period, not that it prevented firming throughout 7 days or extended microbiological shelf life. The direction is consistent with Yin et al. [8], who reported lower hardness and delayed storage-related deterioration in lipase-treated toast, and with broader reviews describing anti-staling effects of bakery enzymes [16]. However, the present trajectories converged substantially by day 7, which argues against a persistent protective effect in this dataset. The lower early firmness is also compatible with previously proposed lipid-mediated effects, but because lipid hydrolysis products were not quantified, the specific biochemical pathway responsible cannot be established here. The data therefore support only a descriptive early-storage textural response that requires independent batch replication before generalization.
The empirical n = 1 firming index was lowest for PE 0.03 plus butter (0.6126 day⁻¹), followed by PE 0.01 plus butter (1.1806 day⁻¹). This ranking is consistent with the delayed early rise in measured firmness. However, firmness integrates multiple processes, including moisture redistribution, starch reassociation, cell-wall geometry, and interactions among starch, protein, and lipids. The index is therefore treated as a descriptive summary of the observed firmness trajectory rather than a rate constant for amylopectin crystallization. The exploratory two-factor ANOVA on technical/spatial firmness readings indicated treatment, time, and treatment-by-time separation, but these p-values are not interpreted as confirmatory treatment-level inference because the three readings per cell were positions within a slice rather than independent baking replicates.
3.10. Instrumental Color
Formulation-related color differences were more pronounced in the crust than in the crumb (Table 7; Figure 9). The untreated crust had L* = 48.56, a* = 18.43, and b* = 29.62. PE 0.03 plus butter showed crust L* = 57.38 and b* = 33.55, with ΔE*ab = 9.67 relative to the control. Butter alone showed a crust ΔE*ab of 7.73. The complete SE and PE color values remain reported in Table 8 as descriptive formulation data; no activity-equivalent PE-versus-SE performance comparison is made.
Crumb color was more stable (Table 8). PE 0.03 plus butter had crumb L* = 74.05 compared with 74.20 for control and ΔE*ab = 1.31. Across non-control formulations, crumb ΔE*ab ranged from 0.15 to 3.82. The stronger crust response is physically reasonable because the surface experiences higher heat flux, dehydration, reactant concentration, and browning than the crumb, and butter can alter surface heat transfer and composition. Because color was measured as a fresh-bread endpoint and the retained replication structure was not balanced at the independent-batch level, the color data are descriptive and should not be used to claim a lipase-specific browning mechanism.
3.11. Sensory Quality
Day-1 sensory evaluation showed generally favorable ratings across the tested formulations, with mean overall-acceptability scores ranging from 7.08 to 8.25 on the 10-point scale (Table 9; Figure 10). All formulation means are reported in Table 9. Because PE and SE were not activity-matched, the sensory data are not used to make PE-versus-SE performance claims. The sensory interpretation therefore focuses on the omnibus repeated-measures analysis and the prespecified multiplicity-adjusted comparisons rather than on ranking PE against SE.
Springiness provided the clearest inferential sensory result. It differed among formulations (Friedman p = 0.0010; Kendall's W = 0.258) and remained significant after Holm correction across the nine attributes (adjusted p = 0.0091). The effect size indicates a small-to-moderate formulation-related difference rather than a large sensory effect. In the planned Holm-adjusted control-versus-treatment contrasts, SE 0.01 was lower than the untreated control for springiness (mean difference -1.42; adjusted p = 0.0176). PE 0.03 plus butter had a numerical mean springiness score of 9.00, compared with 8.42 for the control, but this numerical difference is not presented as statistically significant because it was not supported by the planned multiplicity-adjusted contrast. No exhaustive all-pairs post-hoc ranking among every non-control formulation pair was used, so no additional pairwise differences are claimed. Overall acceptability had an unadjusted omnibus p = 0.0075 but did not remain significant after the global Holm correction (adjusted p = 0.0599); its treatment ranking is therefore descriptive. No treatment effect was detected for rancidity under the day-1 test conditions.
3.12. Integrated Interpretation, Strengths, and Limitations
The study links environmental recovery, extracellular enzyme production, biochemical characterization, downstream preparation, and food application within one experimental sequence. This integrated source-to-application design is the practical contribution of the study; it is not presented as proof that no previous study has combined similar stages. NOS2 was selected on the basis of functional enzyme-production data and preparation behavior, and the same produced preparation was subsequently examined in bread. The observed dose ranking changed with formulation context, emphasizing that upstream enzyme characterization and practical food performance address related but distinct questions.
Several limitations define the scope of the conclusions. Species assignment was based on conventional characterization and BD Phoenix M50 automated phenotypic identification; NOS2 was identified as Bacillus licheniformis with 99% Phoenix confidence, but sequence-based confirmation was not performed. Accordingly, the species name is retained as a qualified phenotypic identification rather than a molecular taxonomic claim. PE and SE were compared at equal powder mass rather than equivalent catalytic activity; SE is therefore a formulation-context reference, and the results do not establish intrinsic catalytic superiority. Each bread formulation was produced as one independent dough batch, so physical bread measurements are descriptive and cannot provide treatment-level causal inference. Butter-containing formulations also received 590 mL kg⁻¹ flour compared with 600 mL kg⁻¹ for non-butter formulations; because water was not matched, butter-versus-non-butter contrasts may reflect both added fat and this small water difference. Monoacylglycerols, diacylglycerols, free fatty acids, and other lipid-hydrolysis products were not quantified, so lipid-mediated explanations remain literature-supported mechanisms rather than directly demonstrated pathways. The thermal pre-exposure experiment used a crude aqueous extracellular preparation that was blank-corrected and physically separated from the visible oil layer but was not dialyzed/desalted and did not include an independently heat-inactivated matrix control; consequently, the non-monotonic titrimetric response is interpreted at the preparation level only. No microbiological shelf-life endpoint was measured.
- CONCLUSION
Oil-associated soils and oil-cake residues yielded extracellular lipase-producing Bacillus isolates under the applied heat-selective recovery protocol, which preferentially selected heat-tolerant and/or spore-forming organisms. Eleven isolates were phenotypically identified by BD Phoenix M50 as Bacillus licheniformis, Bacillus subtilis, or Bacillus cereus; NOS2, subsequently used for bread application, was identified phenotypically as Bacillus licheniformis with 99% confidence. LSSS1, NOS2, and NOSS1 showed the highest crude specific activities among the tested isolates and the highest measured immediate catalytic activities under the tested pH and temperature conditions occurred at pH 6 and 37 °C. Thermal pre-exposure produced a non-monotonic apparent titrimetric response in the crude aqueous preparations; these data are retained as preparation-level observations and are not interpreted as proof of molecular thermostability or heat activation. Sephadex G-100 increased specific activity by 2.75-4.88-fold, and relative post-lyophilization activity after reconstitution was 77.42-83.56%, with NOS2 highest.
In the bread application, PE and the commercial comparator were evaluated at equal powder mass, with SE retained only as a formulation-context reference because the preparations were not activity-matched. Within the single-batch trial, PE 0.03 plus butter showed an observed mean SLV of 3.191 ± 0.033 mL g⁻¹ and observed fresh and day-1 firmness values of 119.3 ± 11.0 and 203.7 ± 14.3 g. These are descriptive within-batch observations rather than independently replicated treatment effects. Sensory springiness differed among formulations after multiplicity correction, with a small-to-moderate Kendall's W, while overall acceptability did not establish a confirmed preference hierarchy. The findings therefore support further evaluation of the NOS2 preparation in independently replicated baking trials using activity-standardized comparators and tighter formulation control; application suitability and reproducibility are not considered established by the present exploratory bread experiment.
- Bacillus licheniformis
- Bread
- Enzyme Stability
- Food Technology
- Hardness
- Lipase
##submission.howToCite##
参考
[1]. Abdelaziz AA, Abo-Kamar AM, Elkotb ES, Al-Madboly LA. Microbial lipases: Advances in production, purification, biochemical characterization, and multifaceted applications in industry and medicine. Microb Cell Fact. 2025; 24: 40. https://doi.org/10.1186/s12934-025-02664-6
[2]. Qian J, Wang Y, Hu Z, Shi T, Wang Y, Ye C, Huang H. Bacillus sp. as a microbial cell factory: Advancements and future prospects. Biotechnol Adv. 2023; 69: 108278. https://doi.org/10.1016/j.biotechadv.2023.108278
[3]. Akinsemolu AA, Onyeaka H, Odion S, Adebanjo I. Exploring Bacillus subtilis: Ecology, biotechnological applications, and future prospects. J Basic Microbiol. 2024; 64: e2300614. https://doi.org/10.1002/jobm.202300614
[4]. Pham VHT, Kim J, Chang S, Chung W. Investigation of lipolytic-secreting bacteria from artificially polluted soil using a modified culture method and optimization of their lipase production. Microorganisms. 2021; 9: 2590. https://doi.org/10.3390/microorganisms9122590
[5]. Mahnashi MH, Hombalimath VS, Shaikh IA, Muddapur UM, Desai SV, Achappa S, El-Sherbiny M, Ghoneim MM, Jefri OA, Alshahrani MM, Alhujaily M, Al Ali A, Mannasaheb BA, Al Awadh AA, Khan AA. Production of extracellular lipase by Bacillus halotolerans from oil-contaminated soil in a pilot-scale submerged bioreactor. Processes. 2022; 10: 1548. https://doi.org/10.3390/pr10081548
[6]. Vichare SA, Morya S. Exploring waste utilization potential: Nutritional, functional and medicinal properties of oilseed cakes. Front Food Sci Technol. 2024; 4: 1441029. https://doi.org/10.3389/frfst.2024.1441029
[7]. Goswami H, Bishoyi AK, Sanghvi G. Enhancing functional and nutritional properties of wheat-based bakery products using microbial lipases. Food Chem X. 2025; 33: 103435. https://doi.org/10.1016/j.fochx.2025.103435
[8]. Yin L, Wei Y, Wu W, Peng Y, Ding W, Xiao S, He B, Wang X, Wu Y. Effect of enzymes on baking quality of wheat dough and storage quality of toast bread. Int J Food Sci Technol. 2024; 59: 9479-9489. https://doi.org/10.1111/ijfs.17597
[9]. Stemler CD, Geisslitz S, Cutignano A, Scherf KA. Lipidomic insights into the reaction of baking lipases in cakes. Front Nutr. 2023; 10: 1290502. https://doi.org/10.3389/fnut.2023.1290502
[10]. Setlow P, Christie G. New thoughts on bacterial spore resistance. Microbiol Mol Biol Rev. 2023; 87: e00080-22. https://doi.org/10.1128/mmbr.00080-22
[11]. Demirkan E, Çetinkaya AA, Abdou M. Lipase from new isolate Bacillus cereus ATA179: Optimization of production conditions, partial purification, characterization and its potential in the detergent industry. Turk J Biol. 2021; 45: 287-300. https://doi.org/10.3906/biy-2101-22
[12]. Almansoori AKK, Reddy NS, Abdulfattah M, Ismail SS, Abdul Rahim R. Characterization of a novel subfamily 1.4 lipase from Bacillus licheniformis IBRL-CHS2: Cloning and expression optimization. PLoS One. 2024; 19: e0314556. https://doi.org/10.1371/journal.pone.0314556
[13]. Kaur M, Kumar R, Katoch P, Gupta R. Purification and characterization of extracellular lipase from thermotolerant Bacillus subtilis TTP-06. 3 Biotech. 2023; 13: 343. https://doi.org/10.1007/s13205-023-03717-6
[14]. Wang Z, Li L, Ren G, Duan X, Guo J, Liu W, Ang Y, Zhu L, Ren X. A comprehensive review on stability of therapeutic proteins treated by freeze-drying: Induced stresses and stabilization mechanisms involved in processing. Drying Technol. 2022; 40: 3373-3388. https://doi.org/10.1080/07373937.2022.2048847
[15]. Ma M, Mu T, Sun H, Zhou L. Evaluation of texture, retrogradation enthalpy, water mobility, and anti-staling effects of enzymes and hydrocolloids in potato steamed bread. Food Chem. 2022; 368: 130686. https://doi.org/10.1016/j.foodchem.2021.130686
[16]. Chowdhury MAH, Sarkar F, Reem CSA, Rahman SM, Mahamud AGMSU, Rahman MA, Ashrafudoulla M. Enzyme applications in baking: From dough development to shelf-life extension. Int J Biol Macromol. 2024; 282(Pt 4): 137020. https://doi.org/10.1016/j.ijbiomac.2024.137020
[17]. Santos AC, Morais RA, Martins GAS, Carvalho EEN, Souza ARM, Miguel KOR, Damiani C. Effect of commercial lipase incorporation on technological properties of bread. Int Food Res J. 2024; 31: 681-695. https://doi.org/10.47836/ifrj.31.3.13
[18]. Lin N, Yang Y, Huo T, Niu Y, Zhao R. Effect of lipase synthesized by Moesziomyces aphidis on the quality of frozen cooked noodles and bread. Food Sci. 2025; 46: 120-126. https://doi.org/10.7506/spkx1002-6630-20250626-194
- 摘要 ##plugins.themes.ojsPlusA.frontend.article.viewed##: 0 ##plugins.themes.ojsPlusA.frontend.article.times##
- Pdf (English) ##plugins.themes.ojsPlusA.frontend.article.downloaded##: 0 ##plugins.themes.ojsPlusA.frontend.article.times##