Survival of Free and Alginate/Pullulan-microencapsulated Lacti-caseibacillus Rhamnosus GG in Soft Goat Cheese During Refrigerated Storage and Simulated in vitro Digestion
Applied Food Biotechnology,
Vol. 13 No. 1 (2026),
7 December 2025
,
Page 1-15 (e30)
https://doi.org/10.22037/afb.v13i1.53254
Abstract
Background and Aim: Probiotic cultures often lose viability during processing and storage, which limits their use in functional dairy products. This study compared the survival of free and alginate/pullulan-microencapsulated Lacticaseibacillus rhamnosus GG ATCC 53103 (LGG) in soft goat cheese during refrigerated storage and simulated in vitro digestion.
Methods: Goat milk was pasteurized at 85 °C for 10 s, inoculated with a commercial starter culture and rennet and then held at 30 °C ±1 for 15 h. The curd was salted with 1% (ww-1) NaCl and stored at 4 °C for 30 d. The LGG was added as free cells or in alginate/pullulan microcapsules and three independently made batches were assessed. Free cells were mixed with trehalose (20% of cell mass) as a cryoprotectant before freeze-drying. Microcapsules were assessed using optical and scanning electron microscopy. A modified two-stage in vitro digestion model was used to investigate bacterial survival during simulated gastrointestinal digestion.
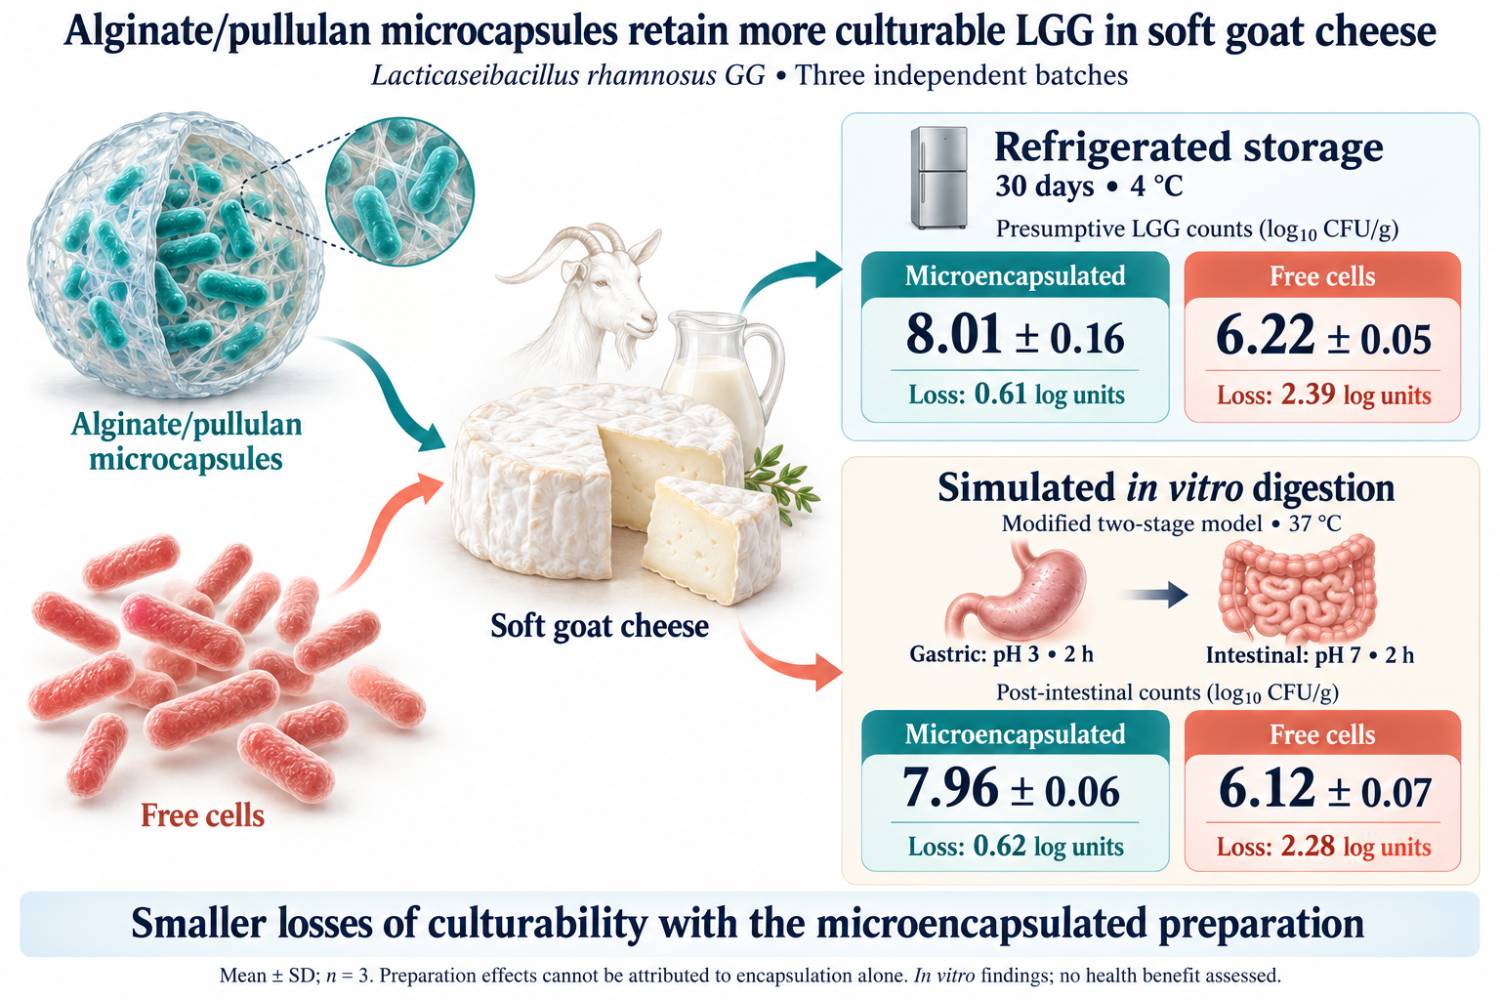
Results and Conclusion: Presumptive LGG counts on MRS agar decreased during storage in the two cheeses, but the decrease was smaller in the cheese containing microcapsules. On Day 30, counts were 8.01 ±0.16 log CFU·g-1 for encapsulated cells and 6.22 ±0.05 log CFU·g-1 for free cells, corresponding to losses of 0.61 and 2.39 log units, respectively. The difference between treatments at this time point was significant (adjusted p < 0.05). After the intestinal phase of simulated digestion, counts were 7.96 ±0.06 log CFU·g-1 for encapsulated cells and 6.12 ±0.07 log CFU·g-1 for the free cells. Under the conditions assessed, alginate/pullulan microencapsulation improved the retention of culturable LGG in soft goat cheese during refrigerated storage and simulated gastrointestinal digestion.
- INTRODUCTION
Within the past few decades, consumers have shown increasing interests in functional foods, which may offer health benefits in addition to basic nutrition [1,2]. Probiotic foods are a major group within this category. They contain live microorganisms that confer a health benefit on the host when administered in adequate quantities [3]. Probiotic bacteria have been shown to help maintain the balance of the intestinal microbiota, support immune function and prevent gastrointestinal disorders [3–5]. Dairy products are widely used to deliver probiotic cultures to consumers because they suit these organisms well and are technologically convenient [6–8].
Industrial use of probiotics is limited by two requirements. Enough viable cells must persist through processing and storage and the cells must survive passage through the gastrointestinal tract (GIT) [9–11]. A probiotic product must include enough viable cells until the end of its shelf life. There is, however, no single minimum count that holds for every strain and every health outcome. The quantity the product delivers should match the dose that is shown effective for that particular strain and the intended benefit [9]. In the GIT, viability decreases by low gastric pH, bile salts and digestive enzymes. During processing and storage, it decreases by heating, oxygen exposure, osmotic stress, dehydration and prolonged refrigeration [10–12]. Goat milk is not an inherently poor matrix for probiotic cultures: its nutrient composition may support their survival. Its casein profile and physicochemical characteristics, however, can affect fermentation, curd formation, texture and the viability of individual strains [13–15]. Thus, probiotic survival needs assessment for each strain-matrix combination.
Freeze-drying, spray-drying and microencapsulation have been developed to improve probiotic survival. Microencapsulation is generally addressed as the most promising technique. The capsule wall shields cells from adverse conditions and may allow targeted delivery and controlled release in the intestines [16,17]. How well it acts depends on the wall material, encapsulation method, particle size and strain as well as processing and storage conditions [17]. Most current studies use natural biopolymers such as alginate, pectin, chitosan, starch, plant gums and dairy and plant proteins. Prebiotic ingredients, including inulin, fructooligosaccharides, galactooligo-saccharides and resistant starch, can be added to the matrix. Such a formulation should be called synbiotic only if the host microorganisms or the coadministered strain select-ively use the substrate and the combination has been shown to confer a health benefit [18,19].
Goat cheese has been studied as a probiotic carrier because of its nutritional value and its physicochemical composition [13,20]. Studies with free and microen-capsulated strains of Lactobacillus, Lacticaseibacillus and Bifidobacterium show that adding probiotics can change the physicochemical, textural and sensory characteristics of goat cheese. The direction and size of these changes depend on the strain, encapsulation system, cheese formulation and storage conditions [20–22]. In a previous study on goat cheese, microencapsulated probiotics survived refrigerated storage better than that free cells did [21,22]. Lopes et al. [21] detected that microencapsulated L. acidophilus La-05 in spreadable goat Ricotta tolerated simulated gastrointestinal digestion better. A few studies, however, have directly compared free and microen-capsulated L. rhamnosus GG (LGG) in soft goat cheeses.
Microencapsulation of probiotics has been studied extensively [16,17]; however, most of this studies were carried out in model systems rather than in fermented foods. For goat cheese, published data concern majorly other strains or other wall materials [20–22] and the current study detected a few reports on L. rhamnosus GG (LGG) in soft goat cheese [20–24]. The authors’ previous results showed that an alginate/pullulan matrix protects LGG when the capsules were assessed [23]. However, this effect was preserved after the capsules were added to an acid-rennet goat cheese. To the authors’ best knowledge, free and encapsulated LGG have rarely been compared in similar cheeses during cold storage and then simulated digestion [20–24]. Such a comparison is needed, since cells that survive storage may be lost in the gastric or intestinal phase and the cheese matrix may change viability and release [16,17].
In this study, LGG was encapsulated in algin-ate/pullulan (without a bacterial cellulose coating) and added to soft goat cheese from acid-rennet coagulation. Cheeses with free and encapsulated LGG were prepared from a similar formulation in three independent batches. Viable counts were assessed at 4 °C within 30 d and the stored cheeses were then subjected to a modified two-stage in vitro digestion (gastric phase followed by intestinal phase). The authors asked if encapsulation gives LGG a survival advantage in this cheese, first during storage and then under simulated gastrointestinal conditions. This study aimed to compare the viability of free and alginate/pullulan-microencapsulated LGG in soft goat cheese made by acid-rennet coagulation at 4 °C within 30 d of storage. The study also assessed cell survival in a modified two-stage in vitro digestion model.
- MATERIALS AND METHODS
2.1. Materials
The L. rhamnosus GG ATCC 53103 (LGG) was pur-chased from the American Type Culture Collection (ATCC, USA). De Man-Rogosa-Sharpe (MRS) broth and MRS agar were purchased from Titan Biotech, India. Goat milk was purchased from a private farm in Talgar, Almaty Region, Kazakhstan. The commercial starter culture BIOCHEM MSY-910, Italy, was used for cheese manu-facture. According to the manufacturer, the starter culture contained Lactococcus lactis subsp. cremoris, L. lactis subsp. lactis, L. lactis subsp. lactis biovar diacetylactis, Leuconostoc mesenteroides subsp. cremoris and Strepto-coccus thermophilus. Strain-level identification and culture collection accession numbers for these starter micro-organisms were not provided by the manufacturer. Sodium alginate was purchased from Sigma-Aldrich, Germany, and calcium chloride (CaCl₂) was purchased from Fisher Scientific, Canada. Pullulan, trehalose, sodium chloride (NaCl), sodium citrate, vancomycin, hydrochloric acid (HCl), sodium hydroxide (NaOH), pepsin, pancreatin and bile salts were purchased from AppliChem, Germany. Sterile distilled water (DW) and sterile saline solution were used through the experimental procedures where needed. Liquid rennet (18,000 IMCU·ml⁻¹) was purchased from Poleznaya Partiya, Russia, and used for acid-rennet coagulation during cheese manufacture. For molecular analyses, PureLink genomic DNA mini kit was purchased from Invitrogen, Thermo Fisher Scientific, USA. Poly-merase chain reaction (PCR) amplification was carried out using 2× Taq Mix (PCR Master Mix; Sisco Research Labo-ratories, India). The LGG-F (5′-CGCCC-TTAACAGC-AGTCTTCAAAT-3′) and LGG-R (5′-ACGCGCCCTCC-GTATGCTTAAACC-3′) primers were used for the detec-tion of the LGG-associated markers. Nuclease-free water was used for preparation of PCR mixtures. For electro-phoretic analysis, agarose gels were prepared in TAE buffer and 100-bp DNA ladder was used as the molecular size marker. Ethidium bromide (EtBr) was purchased from Thermo Scientific, USA, and used for the visualization of PCR products.
2.2. Cultivation of the Probiotic Strain
The L. rhamnosus GG ATCC 53103 is one of the most extensively studied probiotic strains. The authors chose it because its survival under processing stresses and gastro-intestinal conditions was well documented [10,11,24,25]. The LGG was grown in MRS broth (Titan Biotech, India). Viable counts were assessed by plating on MRS agar and incubating at 37 °C for 48 h and expressed as colony-forming units (CFU).
2.3. Physicochemical Analysis of Goat Milk
Goat milk was purchased from a local farm in Talgar, Almaty Region, Kazakhstan, and analyzed raw and after pasteurization at 75 °C for 15 s or 85 °C for 10 s. Fat, protein, lactose, total solids and solids-not-fat (SNF) contents (%, w/w) were assessed using Klever-2 compact milk analyzer (ULIKOR; NPP BIOMER, Russia). Density was assessed at 20 °C using Quevenne lactodensimeter (Funke-Gerber, Germany). Moreover, pH was assessed using calibrated digital pH meter 150MI (Izmeritelnaya Tekhnika, Russia) and titratable acidity was expressed in degrees Turner (°T).
2.4. Preparation of Experimental Soft Goat Cheese Samples
Three soft goat cheese treatments were prepared by acid-rennet coagulation; each in triplicate. The control cheese (C1) was prepared with the commercial starter culture BIOCHEM MSY-910, Italy, alone. This culture contained L. lactis subsp. cremoris, L. lactis subsp. lactis, L. lactis subsp. lactis biovar diacetylactis, Leuconostoc mesenteroides subsp. cremoris and S. thermophilus. Cheeses C2 and C3 received a similar starter and the candidate probiotic strain LGG as microencapsulated cells in C2 and free freeze-dried cells in C3. The LGG was encapsulated by ionotropic gelation with sodium alginate (Sigma-Aldrich, Germany) [23]. The current procedure differed from the published protocol in needle diameter and CaCl₂ concentration and the capsule wall did not contain bacterial cellulose. A 2% (w/v) alginate stock solution was prepared by dissolving 2 g of sodium alginate in 100 ml of sterile DW with continuous stirring. Separately, a sus-pension of LGG (nearly 10⁹ CFU·ml-1) containing pullulan was prepared. Ten milliliters of this suspension were well mixed with 40 ml of the alginate stock solution. The mixture was extruded dropwise into 100 ml of stirred 0.1 M CaCl₂ (Fisher Scientific, Canada). Extrusion used sterile syringe with 0.60-mm needle held 25 cm above the solution surface. The beads were set in the CaCl₂ solution for another 30 min to complete gelation.
After each independently prepared batch, the capsules were collected, washed with sterile saline and weighed. Fifty milliliters of extrusion mixture yielded 27.65, 28.90 and 25.60 g of wet microcapsules (mean ±SD (standard deviation), 27.38 ±1.67 g; n = 3). Encapsulation efficiency was assessed on a 1 g portion from each batch.
The microcapsules were freeze-dried using LyoQuest-80 freeze dryer (Telstar, Spain) for 24 h at a condenser temperature of nearly -85 °C and a chamber pressure of nearly 0.1 mbar. These were then transferred directly to airtight containers and stored at 4 °C until use [25,26]. Free LGG cells were freeze-dried under similar conditions. Trehalose was selected as a cryoprotectant based on its reported protective effects during freezing and freeze-drying of LGG [27]. In the present study, sterile trehalose was added to the free cells immediately before freezing at 20% of the cell mass, followed by gentle mixing for 10 min. Inoculation doses were adjusted for encapsulation efficiency to create an initial count of 8 log CFU·g-1 in the finished cheese.
Goat milk was purchased from a private farm in Talgar, Almaty Region, Kazakhstan, in three separate 60-l batches. Each batch was pasteurized at 85 °C for 10 s, cooled to 30 °C and divided into three equal portions. The starter culture was added to each portion at 1% (vw-1). Furthermore, C2 received freeze-dried microcapsules. The C3 received an equivalent quantity of freeze-dried free cells resuspended in sterile saline.
Liquid rennet (Poleznaya Partiya, Russia; 18,000 IMCU·ml-1) was added immediately after inoculation at 0.5 ml per 100 l of milk. The milk was incubated at 30 °C ±1 for 15 h to set acid-rennet coagulation. The curd was then cut into small cubes, transferred into sterile cotton bags and drained at 15 °C for 10 h. The drained curd was salted with 1% (ww-1) NaCl, packed into individual plastic containers and stored at 4 °C.
2.5. Assessments of Encapsulation Efficiency
Encapsulation efficiency was defined as the total number of viable cells recovered from all the wet microcapsules divided by the number of cells initially added to the sodium alginate solution [23]. To release entrapped cells, 1 g of wet microcapsules was suspended in 9 ml of 0.1 M sodium citrate. The suspension was stirred continuously at room temperature (RT) for 20 min, until the alginate matrix was fully dissolved. Serial tenfold dilutions were then prepared and viable cells were counted by spread plating on MRS agar as described in Section 2.6. Encapsulation efficiency (EE) was calculated by Eq. 1:
Eq. 1
where, Nwet was the number of viable cells released from 1 g of wet microcapsules (CFU·g-1); mwet was the total mass of the wet microcapsules achieved (g); C₀ was the concentration of viable cells in the initial bacterial suspension (CFU·ml-1); and V₀ was the volume of bacterial suspension used for encapsulation (ml). All calculations used absolute CFU values, not log-transformed values. Viable counts were assessed for each of the three independently prepared microcapsule batches and reported as mean ±SD. The EE was calculated from the mean counts and the total wet microcapsule mass.
2.6. Enumeration of Viable Probiotic Cells
To assess presumptive LGG counts, 10 g of cheese were mixed with 90 ml of 0.1 M sodium citrate, homogenized and stirred at RT for 20 min until the alginate/pullulan microcapsules were fully disintegrated. Serial tenfold dilutions were prepared in sterile saline (0.85% NaCl). Aliquots (0.1 ml) of appropriate dilutions were spread using sterile spreader onto MRS agar (pH 6.2) containing 10 mg·l-1 vancomycin. Plates were incubated anaerobically at 37 °C for 48 h. Vancomycin was added to favor recovery of LGG and suppress vancomycin-sensitive members of the background microbiota. The media were not fully selective, because Leuconostoc spp., including the starter component L. mesenteroides, were intrinsically resistant to vancomycin [28]. Colonies growing on this media were therefore counted as presumptive LGG. For C2 and C3, plates with 30–300 colonies were counted. Counts were calculated as CFU·g-1 of cheese and then log-transformed (log CFU·g-1). Representative colonies from C2 and C3 were screened by PCR for an LGG-associated marker, as described in Section 2.7. Plates from C1 served as qualitative controls for background microbiota. Growth on these plates was not quantified as CFU·g-1 within time and no C1 colonies were selected for PCR.
2.7. Microscopy of Microcapsules
Optical microscopy: The study assessed the morphology and size distribution of wet alginate/pullulan microcapsules using Olympus CX23 optical microscope (Olympus, Japan) fitted with a digital camera. Freshly prepared, washed microcapsules were transferred onto glass slides under coverslips and viewed with 4 and 40× objective lens. Capsule diameters were assessed using ImageJ [National Institutes of Health (NIH), USA]. The 4× micrograph was calibrated against a field-of-view diameter of 5.0 mm (field no. of 20). Equivalent diameters were assessed for 14 fully visible, non-overlapping wet microcapsules. The surface morphology of freeze-dried microcapsules was assessed using Quanta 3D 200i scanning electron microscope (FEI, USA). Samples were mounted on aluminum stubs with double-sided carbon tape. Images were captured under high vacuum at 15 kV and working distance of nearly 10–13 mm, at magnifications from 150 to 30,000×. Images at 150× showed the overall shape of individual microcapsules. Images at 5,000 and 30,000× showed the surface microstructure and putative rod-shaped structures associated with the alginate/pullulan matrix.
2.8. The PCR Detection of Lacticaseibacillus rhamnosus GG ATCC 53103-associated Marker
To check the identity of presumptive LGG, 30 colonies were selected from vancomycin-supplemented MRS plates for C2 and 30 for C3. Sampling was stratified as two colonies were selected random from each of the three cheese batches at each of the five storage times. C1 colonies were not assessed. Each colony was grown in MRS broth at 37 °C for 18–24 h under anaerobic conditions. Genomic DNA was then extracted using PureLink Genomic DNA mini kit (Invitrogen, Thermo Fisher Scientific, USA) according to the manufacturer’s instructions. Moreover, DNA concentration (A₂₆₀) and purity (A₂₆₀/A₂₈₀ and A₂₆₀/A₂₃₀) were assessed using NanoDrop 2000 spectrophotometer (Thermo Fisher Scientific, USA). The primers of LGG-F (5′-CGCCC-TTAACAGCAGTCTTCAAAT-3′) and LGG-R (5′-ACGCGCCCTCCGTATGCTTAAACC-3′) were desc-ribed by Ahlroos and Tynkkynen [29] and later used in end-point PCR [30]. They targeted the region in GenBank accession no. EU709012.1, which contained part of the ISLrh1 transposase gene and an adjacent gene for a putative membrane-associated protein. The expected product was nearly 0.76 kb. Each 20 μl reaction contained 10 μl of 2× Taq mix (PCR master mix; Sisco Research Laboratories, India), 0.5 μM of each primer, 1 μl of template DNA and nuclease-free water. Amplification was carried out using Bio-Rad S1000 thermal cycler (Bio-Rad, USA): 95 °C for 2 min; 30 cycles of 95 °C for 30 s, 60 °C for 30 s and 72 °C for 30 s; and finally, 72 °C for 5 min [30]. Products were separated in 1.2% agarose gels in TAE buffer with 100-bp ladder, stained with EtBr (Thermo Scientific, USA) and imaged using ChemiDoc XRS system (Bio-Rad, USA). Genomic DNA of L. rhamnosus GG ATCC 53103 was the positive control. Negative controls were a no-template reaction (water instead of DNA) and an extraction blank carried through DNA extraction without cells. Because this primer pair could amplify DNA from non-GG L. rhamnosus strains [31], a positive result supported but did not verify identification as LGG. Only colonies from the storage experiment were assessed.
2.9. Probiotic Survival during Simulated Gastrointestinal Digestion (INFOGEST Protocol)
The tolerance of microencapsulated (C2) and free (C3) LGG to simulated gastrointestinal conditions was assessed in the finished cheeses. For each treatment, samples from three independently manufactured cheese batches were analyzed (n = 3). Digestion followed the static INFOGEST 2.0 protocol [32], modified by omitting the oral phase and gastric lipase. The model therefore consisted of sequential gastric and intestinal phases only. Gastric phase. Cheese (5 g) was mixed with simulated gastric fluid (SGF) at a final sample-to-fluid ratio of 1:1 (w:v). Each sample received 4 ml of 1.25× SGF electrolyte stock, 2.5 μl of 0.3 M CaCl₂ and pepsin to a final activity of 2,000 U.ml-1. The pH was adjusted to 3.0 with HCl and the volume was made up to 10 ml with DW. Samples were incubated at 37 °C ±1 for 2 h with agitation at 100 rpm. Intestinal phase. Gastric chyme (10 ml) was mixed with 4 ml of 1.25× simulated intestinal fluid (SIF) electrolyte stock, 20 μl of 0.3 M CaCl₂, pancreatin to a final trypsin activity of 100 U·ml and bile salts to a final concentration of 10 mmol·l-1 (1.25 ml of a 160 mmol·l-1 solution). The pH was adjusted to 7.0 with NaOH and the volume was made up to 20 ml with DW. Samples were incubated at 37 °C ±1 for 2 h with agitation at 100 rpm. Pepsin and trypsin activities were assessed before the experiment by the INFOGEST 2.0 assays [32]. Enzyme quantities were calculated from these assessed activities to reach the target values. Viable counts were assessed before digestion, after the gastric phase and after the intestinal phase. A separate parallel sample was prepared for each sampling point. Removing material for counting after the gastric phase, therefore, did not change the volume in the intestinal phase. To disintegrate the microcapsules, 1 ml of digestion mixture was combined with 9 ml of 0.1 M sodium citrate and stirred at RT for 20 min. Samples with free cells were treated in the same way so that preparation was identical for the two groups. Serial tenfold dilutions were made in sterile saline (0.85% NaCl) and 0.1 ml of appropriate dilutions was spread on MRS agar (pH 6.2) containing 10 mg·l-1 vancomycin, as described in Section 2.5. Plates were incubated anaerobically at 37 °C ±1 for 48 h. Calculations accounted for all dilution steps and the total volume of the digestion mixture. Results were expressed as log₁₀ CFU.g-1 of the original cheese sample, using the Eq. 2:
Eq. 2
where, C was the mean number of colonies; d was the reciprocal of the serial dilution plated; 10 was the dilution factor introduced by the citrate treatment (1 ml of digesta in 9 ml of sodium citrate); Vdig was the total volume of the digestion mixture (10 ml for the gastric phase and 20 ml for the intestinal phase); 0.1 was the plated volume (ml); and m was the mass of cheese for digestion (5 g).
2.10. Statistical Analysis
Data are expressed as mean ±SD of three independent production batches (n = 3), with technical replicates aver-aged within each batch. Microbial counts were log₁₀-transformed (CFU·g-1) before analysis. Since every batch contributed to all treatments, sampling times and digestion stages, comparisons between cheese treatments, storage times and digestion stages were carried out with two-sided paired t-tests, pairing by production batch. Physico-chemical characteristics of raw and heat-treated milk were likewise compared with paired t-tests, matching obser-vations by milk batch. The p-values were adjusted using Holm’s method within each family of comparisons. For the milk, each physicochemical parameter formed a family of three pairwise comparisons between treatments. The storage family included 13 comparisons of C2 against C3 at five sampling times and eight comparisons of later time points with Day 0 within each treatment. The digestion family included nine of C2 against C3 at three stages, and the three pairwise comparisons between stages within each treatment. An adjusted p-value less than 0.05 was recorded as significant. With only three batches, the normality of within-pair differences could not be checked reliably and the authors did not treat non-significant results as evidence of equivalence. The microcapsules were described without statistical testing. The study assessed the diameters of 14 particles on a calibrated optical micrograph and report the values as mean ±SD and range; these particles were not independent production replicates. All calculations were carried out using Python 3.13 with SciPy 1.17 [33].
- RESULTS AND DISCUSSION
3.1. Preparation and Characterization of Microencapsulated Lacticaseibacillus rhamnosus GG ATCC 53103
Table 1 summarizes the characteristics of the wet and freeze-dried microcapsules. Counts in the initial bacterial suspension were reported per milliliter and counts in the microcapsules were reported per gram. Morphology is described in Section 3.2. The bacterial suspension contained 9.21 ±0.08 log CFU·ml-1 before encapsulation and the wet microcapsules contained 8.76 ±0.06 log CFU·g-1. From 50 ml of extrusion mixture, 27.38 g of wet microcapsules were achieved. Encapsulation efficiency estimated from the summary data and a wet microcapsule mass of 27.38 g was 97.15%. This estimate did not describe variability in encapsulation efficiency between the batches.
The lower mass of the recovered wet microcapsules relative to the extrusion mixture might partly reflect contraction of the calcium-alginate network and water loss through syneresis during external gelation [34]. Regarding density of the extrusion mixture as roughly 1 g·ml‑1, initial viable-cell concentration was nearly 8.51 log CFU·g-1, against 8.76 log CFU·g-1 in the recovered wet micro-capsules. Water loss concentrated the cells in this way; however, increases in counts did not verify that all cells were preserved; the authors did not assess how much water or how many cells passed into the hardening solution and wash water. The freeze-dried microcapsules contained 10.0 ±0.1 log CFU·g-1. The higher count per gram compared with wet beads reflected water removal during freeze-drying, not an increase in the total number of viable cells. The cells were presumably held in place by the calcium-alginate gel. As the gel network contracted and expelled water, the beads lost mass, which possibly explained part of the difference between the extrusion mixture and the wet beads recovered [34]. The study did not assess how much water or how many cells were into the hardening solution and wash water; hence, the mass balance was incomplete. Therefore, a higher CFU per gram after gelation or freeze-drying reflected concentration not growth, and did not mean that every cell was preserved.
3.2. Morphological Characteristics of Probiotic Microcapsules
Under the optical microscope, the wet microcapsules were mostly spherical, although their shape varied somewhat (Figure 1C). The SEM of freeze-dried samples showed the overall shape of individual beads and the surface structure of the alginate/pullulan matrix (Figure 1D). At higher magnification, rod-shaped structures were visible within the matrix (Figure 1E, F). These were likely immobilized LGG cells.
Capsule size might be a problem for the product. The 14 wet microcapsules in one optical image averaged 850 μm ±170 (460–1143 μm). These large particles could be felt in the mouth as grit; however, the study did not investigate sensory or texture tests and one image revealed nothing about variation between batches. Smaller further uniform capsules are an obvious advancement; though, a new size or production method means re-checking cell recovery, storage stability and release. The study did not investigate how the capsules were distributed in the cheese, which might matter for differences between portions. The micrographs showed what the beads looked like; they could not explain why the cells survived.
Morphology of alginate/pullulan microcapsules containing LGG. (A) Freshly prepared alginate/pullulan microcapsules in a Petri dish; (B) alginate/pullulan microcapsules after collection and washing; (C) optical micrograph of wet alginate/pullulan microcapsules, 4× objective (total magnification approximately 40×); (D) scanning electron microscopy image of a single alginate/pullulan microcapsule showing surface morphology (150×; scale bar, 500 μm); (E) high-magnification scanning electron microscopy image of rod-shaped structures, possibly Lacticaseibacillus rhamnosus GG ATCC 53103 cells, associated with the alginate/pullulan matrix (30,000×; scale bar, 4 μm); (F) scanning electron microscopy image of the alginate/pullulan matrix surface with embedded rod-shaped structures, possibly Lacticaseibacillus rhamnosus GG ATCC 53103 cells (5,000×; scale bar, 20 μm).
The wet microcapsules assessed in ImageJ on the calibrated optical micrograph included a mean diameter of 850 μm ±170 (SD), with individual values from nearly 460 to 1143 μm (n = 14). The coefficient of variation was nearly 20%, similar to the visible variation in particle shape and size. The polymer matrix possibly protected the cells by limiting their direct contact with adverse components of the cheese, which improved probiotic stability during storage. The microcapsules were then added to soft cheese to assess if encapsulation improved LGG survival in the product.
3.3. Viability of Lacticaseibacillus rhamnosus GG ATCC 53103 in Experimental Soft Goat Cheese
3.3.1. Physicochemical characteristics of raw and pasteurized goat milk
The composition of goat milk largely assessed cheese yield and curd structure. The study therefore assessed density, fat, protein, lactose, total solids, titratable acidity and pH in the cheese-making milks. These data described the freshness and suitability of the raw milk and showed how it responded to pasteurization. Protein and casein, in particular, governed curd firmness and whey drainage. Fat contributed to the soft texture and mouthfeel of the cheese and initial acidity and pH affected the rate of acidification. Table 2 which summarizes the major milk characteristics, shows composition and physicochemical characteristics of the raw and pasteurized goat milks. Fat content was 5.39% ±0.08 in raw milk and 5.43% ±0.07 and 5.45% ±0.06 after heating at 75 and 85 °C. Protein content was 3.42% ±0.05, 3.43% ±0.04 and 3.45% ±0.05 and lactose content was 4.47% ±0.06, 4.45% ±0.05 and 4.43% ±0.06, in a similar order. Total solids ranged from 13.91 to 13.98% and SNF from 8.52 to 8.54%. No mean differed from another by more than 0.12 percentage points and none of the differences was significant (adjusted p > 0.05). Heat treatment therefore included no detectable effect on the milk composition. With three batches, however, this did not show that the treatments were similar.
Density increased from 27.84 °A ±0.15 in raw milk to 27.90 °A ±0.14 at 75 °C and to 28.20 °A ±0.16 at 85 °C. The pH decreased from 6.65 ±0.03 to 6.62 ±0.03 and 6.60 ±0.02 and titratable acidity increased from 17.2 °T ±0.5 to 17.5 °T ±0.4 and 17.8 °T ±0.5. These shifts were consistent in direction but were not significant. Changes in mineral balance or whey protein denaturation could explain them; however, the study did not assess these processes.
Milk pasteurized at 85 °C for 10 s was used for all cheeses. Because C1, C2 and C3 were prepared from milk with similar heat treatments, differences between the cheeses could not be attributed to milk preparation. The present data described the milk used in this study. These did not show that the 85 °C treatment was microbiologically safer than 75 °C treatment for 15 s or that it performed equally well in coagulation and fermentation.
3.3.2. Viability of Lacticaseibacillus rhamnosus GG ATCC 53103 during refrigerated storage
Cheeses C2 and C3 were inoculated with microencapsulated and free LGG, respectively, at a target level of 8 log CFU·g-1 (Section 2.3). The two forms were added to the milk before coagulation but ended in the curd differently. The authors expected the spherical microcapsules (Figure 1) dispersed through the curd, whereas the free cells were in direct contact with the cheese matrix. The cheeses were stored at 4 °C for 30 d to simulate cold-chain storage and retail. The study did not monitor cheese pH or titratable acidity during storage; thus, contribution of post-acidification to the loss of viability could not be assessed. The difference between C2 and C3 therefore reflected an overall association with microencapsulation under these storage conditions and could not be linked to a specific physicochemical factor.
Immediately after manufacture, the two probiotic cheeses included almost identical counts of 8.62 ±0.12 log CFU·g-1 with microcapsules (C2) and 8.61 ±0.06 log CFU·g-1 with free cells (C3). Counts then decreased in the two cheeses but at different rates. On Day 30, C2 decreased to 8.01 log CFU·g-1, decrease of 0.61 log and C3 to 6.22 log CFU·g-1, decrease of 2.39 log. The cheeses did not differ significantly on Days 0, 7, 14 or 21 (adjusted p > 0.05). On Day 30, the encapsulated cheese contained 1.79 log CFU·g-1 further culturable cells and the difference was significant (adjusted p < 0.05). In the two treatments, counts on Days 21 and 30 were significantly lower than on Day 0 (adjusted p < 0.05). After 30 d, presumptive LGG counts were still greater than 6 log CFU·g-1 in the two cheeses. That level alone did not prepare either cheese an effective probiotic product. Efficacy needed evidence that the specific strain at an appropriate dose delivered health benefits [9].
Similar results have been reported for goat cheese previously. Lopes et al. [21] improved the survival of L. acidophilus La-05 in spreadable goat Ricotta with alginate-based capsules and Kavas et al. [22] observed better retention of L. paracasei and B. longum in goat cheese, some formulated with inulin or fructooligosaccharides.
Counts of presumptive LGG were lesser in C2 than in C3; thus, the alginate/pullulan microcapsules included further culturable cells during refrigerated storage. The study compared the two preparations as a whole, though. These also differed in formulation and how the cells were protected during freeze-drying; hence, the effect could not be attributed to encapsulation alone.
There was a difference between the treatments with no relationship with entrapment. Free cells were mixed with trehalose before freeze-drying (Section 2.3) but the microcapsules were not. Trehalose affected how LGG tolerated freezing, drying and storage [27]; thus, what the study compared included two preparations as they were made and benefits could partially be from cryoprotection rather than encapsulation. Similar starting counts in the cheese did not guarantee that the dried cells were in similar physiological states. Nor can the authors say what pullulan added, since no alginate-only treatment was set. The authors have treated this simply as a part of the formulation with no evidence of prebiotic or synbiotic effect [18,19].
3.3.3. Verification of Lacticaseibacillus rhamnosus GG ATCC 53103 by strain-specific polymerase chain reaction
The LGG-specific PCR verified that most colonies isolated from the probiotic cheeses belonged to the added strain. Growth on C1 plates reflected the starter and background microbiota, since C1 contained no LGG. These plates were assessed only qualitatively as C1 colonies were not counted over time and were not assessed using PCR. Colonies included in the viable counts were identified using LGG-specific PCR. The expected 762-bp amplicon was achieved from 26 of 30 colonies of C2 (86.7%; 95% CI, 70.3–94.7%) and 28 of 30 colonies of C3 (93.3%; 95% CI, 78.7–98.2%). No amplification occurred in the DNA extraction control or the no-template control. The positive control, genomic DNA from a pure LGG culture, resulted in single product of the expected size.
If the assessed colonies were representative of all cheese batches and storage times, non-LGG colonies inflated plate counts by nearly 0.06 log CFU·g-1 in C2 and 0.03 log CFU·g-1 in C3. Only 30 colonies per treatment were assessed and the confidence intervals were wide; hence, these figures included rough estimates. The study did not use these to correct individual counts. The plate counts were with a caution. Vancomycin-MRS agar was not specific for LGG and other vancomycin-resistant bacteria from the starter or background flora, including Leuconostoc, grew on the agar media [28]. The LGG-associated PCR marker was present in 26 of 30 colonies from C2 and 28 of 30 from C3; thus, marker-positive isolates were recovered through storage. A similar marker, however, selected L. rhamnosus strains other than GG [31]; thus, these ratios could not be reported as the LGG fraction or use to correct the counts. The study assessed only two colonies per batch and time point, none from C1 and none recovered after digestion. This described why the authors reported the counts presumptive LGG.
3.4. Survival of Lacticaseibacillus rhamnosus GG ATCC 53103 during Simulated Gastrointestinal Digestion
Survival of free and microencapsulated presumptive LGG was assessed in a modified two-stage in vitro digestion model with sequential gastric and intestinal phases. Table 3 provides the counts on vancomycin-supplemented MRS agar after each stage. The storage and digestion experiments used various portions of cheese and were plated in separate series. Predigestion counts therefore differed from Day 0 storage counts and survival during digestion was assessed against the pre-digestion level assessed in the digestion experiment.
Before digestion, C2 contained slightly more presumptive LGG than that C3 did (8.58 ±0.06 against 8.40 ±0.05 log CFU·g-1; adjusted p < 0.05). Because the starting levels differed, survival was compared majorly as the loss of viability within each treatment. The gastric phase decreased counts in the two cheeses with various extents as 1.69 log CFU·g-1 in the free-cell cheese and 0.37 log CFU·g-1 in the encapsulated cheese. After this phase, C2 contained significantly more culturable cells than that C3 did (8.21 ±0.05 against 6.71 ±0.08 log CFU·g-1; adjusted p < 0.05).
The intestinal phase caused a further but smaller decrease as 0.25 log CFU·g-1 in C2 and 0.59 log CFU·g-1 in C3. At the end of digestion, counts were 7.96 ±0.06 log CFU·g-1 in C2 and 6.12 ±0.07 log CFU·g-1 in C3 (adjusted p < 0.05). In each treatment, counts after each stage were significantly smaller than that at the previous stage. At the end of digestion, C2 still contained greater than 7 log CFU·g-1 (7.96 ±0.06), whereas C3 decreased to 6.12 ±0.07 log CFU·g-1 (adjusted p < 0.05).
Within the whole digestion, presumptive LGG counts decreased by 0.62 log CFU·g-1 in C2 and 2.28 log CFU·g-1 in C3. Based on the treatment means, the losses differed by 1.66 log units, whereas the two cheeses differed by only 0.18 log CFU·g-1 before digestion. Most of that gap opened in the gastric phase as 1.32 of the 1.66 log units. The microencapsulated preparation therefore included further culturable presumptive LGG under these conditions, although the present data did not show what caused the difference.
Presumptive LGG survived better in cheese with alginate/pullulan microcapsules than in cheese with free cells. After 30 d at 4 °C, counts (from treatment means) decreased by 0.61 log CFU·g-1 in C2 and 2.39 log CFU·g-1 in C3. Simulated digestion resulted in similar findings as 0.62 and 2.28 log CFU·g-1 smaller than the pre-digestion counts. The study could not explain which component of the formulation was responsible or how the protection acted.
Haffner et al. [24] showed that alginate-based microparticles protected LGG in simulated gastrointestinal conditions. The experimental conditions, wall materials and digestion models used in previous studies differed from those used in the present study, which limited direct comparison of effect sizes. What this study added included assessment of an alginate/pullulan formulation inside an acid-rennet goat cheese; in which, the authors observed the two survivals during refrigerated storage and tolerance to simulated digestion. In the two experiments, presumptive LGG counts decreased less with the microencapsulated preparation than free cells. This was the reason to study further on this formulation as a way to deliver probiotics in soft goat cheese. These results are used in the preparation as a whole; though they did not show what pullulan contributed or how the protection acted. In the cheese, the hydrated polymer might slow exchange between cells and their surroundings [16,17]; however, no data were available on permeability, local pH, swelling or release.
After the gastric and intestinal phases, the cells were still culturable. The C2 and C3 entered digestion with various counts; thus, the authors observed losses from each treatment baseline as well as at final numbers. Most of the gap between treatments opened during the gastric phase. Rayment et al. [35] detected that alginate beads shrink in simulated gastric fluid and swell under intestinal conditions. These changes might affect how well the capsules protected the cells and when they released them. However, the study did not investigate how the present capsules behaved during digestion. Whether this reflected protection from acid or the effects of pepsin, cheese buffering, capsule structure or cell release, the current design could not explain. The model was a modified INFOGEST 2.0 without the oral phase or gastric lipase [32]. A static in vitro assay like this says nothing about colonization, persistence in the gut or health effects and we digested cheese at one point only; thus, later tolerance in storage is unknown.
3.5. Study Limitations and Further Directions
Three production batches was a small number. The C2 and C3 were prepared from the same milk; hence, these must be compared batch by batch and extra plates, colonies or sampling times did not add independent replicates. The endpoint and loss comparisons in this section are descriptive, not additional statistical tests. A non-significant difference did not mean the treatments were similar and the small sample alone did not explain why significance occurred within the storage times. Further batches are needed to explain why the difference occurred.
The study did not follow pH, titratable acidity, water activity and salt distribution during storage; hence, the authors could not separate the effects of acidification, osmotic stress and the rest of the cheese matrix. Composition, yield, texture and sensory quality were not fully characterized as well. The results are encouraging enough to continue study on this formulation for preserving presumptive LGG culturable; however, these did not show a longer shelf life or microbiological safety. Reaching a common technological threshold for counts is not similar to a probiotic effect, which requires a verified strain and an evidence-based dose [9]. Further studies should include matched formulation controls, further independent batches, additional strain identification and assessments of cheese characteristics and capsule integrity with the counts.
- CONCLUSION
In soft goat cheese prepared by acid-rennet coagulation, LGG encapsulated in alginate/pullulan included higher presumptive counts than that free cells did in cold storage and during simulated digestion. After 30 d at 4 °C, the encapsulated and free-cell cheeses contained 8.01 ±0.16 and 6.22 ±0.05 log CFU·g-1, decreases of 0.61 and 2.39 log units. At the end of intestinal phase of the modified two-stage digestion model, counts were 7.96 ±0.06 and 6.12 ±0.07 log CFU·g-1 or 0.62 and 2.28 log units less than the values assessed before digestion.
The results address alginate/pullulan microcapsules worth further studies as a way to set probiotic cells culturable in soft goat cheeses. What the authors compared, though, were the two preparations. Because cryoprotection differed between them and there was no alginate-only control, the effects of encapsulation alone and the part played by pullulan, are unresolved. The interpretation is further limited by the small number of independent batches and imperfect specificity of plate counting and PCR identification.
Further studies should include matched formulation controls, further production batches and additional methods of strain identification, with assessments of the cheese physicochemical characteristics, texture and sensory acceptance. The present data showed that culturable presumptive LGG survived under the conditions. These did not show health benefits or longer shelf lives.
- DECLARATIONS
5.1. Conflict of Interest
The authors have no relevant financial or non-financial conflict of interest to disclose.
5.2. Acknowledgments
The authors gratefully acknowledge Al-Farabi Kazakh National University for providing the facilities, laboratory resources and institutional supports.
5.3. Funding
No funding was received for this study.
5.4. Author Contributions
Conceptualization, M.A. and N.B.; methodology, T.T.; software, M.A.; validation, N.B., T.T. and A.Z.; formal analysis, N.B.; investigation, T.T.; resources, N.B.; data curation, N.B.; writing—original draft preparation, M.A.; writing—review and editing, N.B.; visualization, T.T.; supervision, M.A.; project administration, M.A.
5.5. Ethical Considerations
All ethical principles were addressed in carrying out this study and writing this manuscript.
5.6. Data Availability
In accordance with the principles of transparency and open research, the authors declare that all data and materials used in this study are available upon requests.
5.7. Using Artificial Intelligence Chatbots
No AI chatbot was used in this study.
- functional dairy products
- goat milk
- microencapsulation
- probiotics
- viability
- soft cheese
How to Cite
References
1. Granato D, Barba FJ, Bursać Kovačević D, Lorenzo JM, Cruz AG, Putnik P. Functional foods: product development, technological trends, efficacy testing and safety. Annu Rev Food Sci Technol. 2020; 11: 93–118. https://doi.org/10.1146/annurev-food-032519-051708
2. Granato D, Branco GF, Nazzaro F, Cruz AG, Faria JAF. Functional foods and nondairy probiotic food development: trends, concepts and products. Compr Rev Food Sci Food Saf. 2010; 9: 292–302. https://doi.org/10.1111/j.1541-4337.2010.00110.x
3. Hill C, Guarner F, Reid G, Gibson GR, Merenstein DJ, Pot B, Morelli L, Canani RB, Flint HJ, Salminen S, et al. The International Scientific Association for Probiotics and Prebiotics consensus statement on the scope and appropriate use of the term probiotic. Nat Rev Gastroenterol Hepatol. 2014; 11: 506–514. https://doi.org/10.1038/nrgastro.2014.66
4. Sanders ME, Merenstein DJ, Reid G, Gibson GR, Rastall RA. Probiotics and prebiotics in intestinal health and disease: from biology to the clinic. Nat Rev Gastroenterol Hepatol. 2019; 16: 605–616. https://doi.org/10.1038/s41575-019-0173-3
5. McFarland LV, Evans CT, Goldstein EJC. Strain-specificity and disease-specificity of probiotic efficacy: a systematic review and meta-analysis. Front Med. 2018; 5: 124. https://doi.org/10.3389/fmed.2018.00124
6. Ranadheera RDCS, Baines SK, Adams MC. Importance of food in probiotic efficacy. Food Res Int. 2010; 43: 1–7. https://doi.org/10.1016/j.foodres.2009.09.009
7. Karimi R, Mortazavian AM, Da Cruz AG. Viability of probiotic microorganisms in cheese during production and storage: a review. Dairy Sci Technol. 2011; 91: 283–308. https://doi.org/10.1007/s13594-011-0005-x
8. Pitino I, Randazzo CL, Cross KL, Parker ML, Bisignano C, Wickham MSJ, Mandalari G, Caggia C. Survival of Lactobacillus rhamnosus strains inoculated in cheese matrix during simulated human digestion. Food Microbiol. 2012; 31: 57–63. https://doi.org/10.1016/j.fm.2012.02.013
9. Binda S, Hill C, Johansen E, Obis D, Pot B, Sanders ME, Tremblay A, Ouwehand AC. Criteria to qualify microorganisms as “probiotic” in foods and dietary supplements. Front Microbiol. 2020; 11: 1662. https://doi.org/10.3389/fmicb.2020.01662
10. Tripathi MK, Giri SK. Probiotic functional foods: survival of probiotics during processing and storage. J Funct Foods. 2014; 9: 225–241. https://doi.org/10.1016/j.jff.2014.04.030
11. Wendel U. Assessing viability and stress tolerance of probiotics—a review. Front Microbiol. 2022; 12: 818468. https://doi.org/10.3389/fmicb.2021.818468
12. Wang A, Zhong Q. Drying of probiotics to enhance the viability during preparation, storage, food application and digestion: A review. Compr Rev Food Sci Food Saf. 2024; 23: e13287. https://doi.org/10.1111/1541-4337.13287
13. Park YW, Juárez M, Ramos M, Haenlein GFW. Physico-chemical characteristics of goat and sheep milk. Small Rumin Res. 2007; 68: 88–113. https://doi.org/10.1016/j.smallrumres.2006.09.013
14. Ranadheera CS, Evans CA, Adams MC, Baines SK. In vitro analysis of gastrointestinal tolerance and intestinal cell adhesion of probiotics in goat’s milk ice cream and yogurt. Food Res Int. 2012; 49: 619–625. https://doi.org/10.1016/j.foodres.2012.09.007
15. Salva S, Nuñez M, Villena J, Ramón A, Font G, Alvarez S. Development of a fermented goats’ milk containing Lactobacillus rhamnosus: in vivo study of health benefits. J Sci Food Agric. 2011; 91: 2355–2362. https://doi.org/10.1002/jsfa.4467
16. Burgain J, Gaiani C, Linder M, Scher J. Encapsulation of probiotic living cells: from laboratory scale to industrial applications. J Food Eng. 2011; 104: 467–483. https://doi.org/10.1016/j.jfoodeng.2010.12.031
17. Cook MT, Tzortzis G, Charalampopoulos D, Khutoryanskiy VV. Microencapsulation of probiotics for gastrointestinal delivery. J Control Release. 2012; 162: 56–67. https://doi.org/10.1016/j.jconrel.2012.06.003
18. Gibson GR, Hutkins R, Sanders ME, Prescott SL, Reimer RA, Salminen SJ, Scott K, Stanton C, Swanson KS, Cani PD, et al. Expert consensus document: the International Scientific Association for Probiotics and Prebiotics (ISAPP) consensus statement on the definition and scope of prebiotics. Nat Rev Gastroenterol Hepatol. 2017; 14: 491–502. https://doi.org/10.1038/nrgastro.2017.75
19. Swanson KS, Gibson GR, Hutkins R, Reimer RA, Reid G, Verbeke K, Scott KP, Holscher HD, Azad MB, Delzenne NM, et al. The International Scientific Association for Probiotics and Prebiotics (ISAPP) consensus statement on the definition and scope of synbiotics. Nat Rev Gastroenterol Hepatol. 2020; 17: 687–701. https://doi.org/10.1038/s41575-020-0344-2
20. Gomes de Oliveira ME, Fernandes Garcia E, Vasconcelos de Oliveira CE, Pereira Gomes AM, Esteves Pintado MM, Ferreira Madureira ARM, da Conceição ML, Ramos do Egypto Queiroga R de C, de Souza EL. Addition of probiotic bacteria in a semi-hard goat cheese (Coalho): survival to simulated gastrointestinal conditions and inhibitory effect against pathogenic bacteria. Food Res Int. 2014; 64: 241–247. https://doi.org/10.1016/j.foodres.2014.06.032
21. Lopes LAA, Pimentel TC, Carvalho R de SF, Madruga MS, Galvão M de S, Bezerra TKA, Barão CE, Magnani M, Stamford TCM. Spreadable goat ricotta cheese added with Lactobacillus acidophilus La-05: can microencapsulation improve the probiotic survival and the quality parameters? Food Chem. 2021; 346: 128769. https://doi.org/10.1016/j.foodchem.2020.128769
22. Kavas N, Kavas G, Kinik Ö, Ateş M, Kaplan M, Şatir G. Symbiotic microencapsulation to enhance Bifidobacterium longum and Lactobacillus paracasei survival in goat cheese. Food Sci Technol. 2022; 42: e55620. https://doi.org/10.1590/fst.55620
23. Kistaubayeva A, Abdulzhanova M, Zhantlessova S, Savitskaya I, Karpenyuk T, Goncharova A, Sinyavskiy Y. The effect of encapsulating a prebiotic-based biopolymer delivery system for enhanced probiotic survival. Polymers. 2023; 15: 1752. https://doi.org/10.3390/polym15071752
24. Haffner FB, van de Wiele T, Pasc A. Original behavior of L. rhamnosus GG encapsulated in freeze-dried alginate-silica microparticles revealed under simulated gastrointestinal conditions. J Mater Chem B. 2017; 5: 7839–7847. https://doi.org/10.1039/C7TB02190A
25. Sohail A, Turner MS, Coombes A, Bhandari B. The viability of Lactobacillus rhamnosus GG and Lactobacillus acidophilus NCFM following double encapsulation in alginate and maltodextrin. Food Bioprocess Technol. 2013; 6: 2763–2769. https://doi.org/10.1007/s11947-012-0938-y
26. Butorac K, Novak J, Bellich B, Terán LC, Banić M, Leboš Pavunc A, Zjalić S, Cescutti P, Šušković J, Kos B. Lyophilized alginate-based microspheres containing Lactobacillus fermentum D12, an exopolysaccharides producer, contribute to the strain’s functionality in vitro. Microb Cell Fact. 2021; 20: 85. https://doi.org/10.1186/s12934-021-01575-6
27. Pehkonen KS, Roos YH, Miao S, Ross RP, Stanton C. State transitions and physicochemical aspects of cryoprotection and stabilization in freeze-drying of Lactobacillus rhamnosus GG (LGG). J Appl Microbiol. 2008; 104: 1732–1743. https://doi.org/10.1111/j.1365-2672.2007.03719.x
28. Flórez AB, Campedelli I, Delgado S, Alegría Á, Salvetti E, Felis GE, Mayo B, Torriani S. Antibiotic susceptibility profiles of dairy Leuconostoc, analysis of the genetic basis of atypical resistances and transfer of genes in vitro and in a food matrix. PLoS One. 2016; 11: e0145203. https://doi.org/10.1371/journal.pone.0145203
29. Ahlroos T, Tynkkynen S. Quantitative strain-specific detection of Lactobacillus rhamnosus GG in human faecal samples by real-time PCR. J Appl Microbiol. 2009; 106: 506–514. https://doi.org/10.1111/j.1365-2672.2008.04018.x
30. Treven P, Mahnič A, Rupnik M, Golob M, Pirš T, Matijašić BB, Lorbeg PM. Evaluation of human milk microbiota by 16S rRNA gene next-generation sequencing (NGS) and cultivation/MALDI-TOF mass spectrometry identification. Front Microbiol. 2019; 10: 2612. https://doi.org/10.3389/fmicb.2019.02612
31. Endo A, Aakko J, Salminen S. Evaluation of strain-specific primers for identification of Lactobacillus rhamnosus GG. FEMS Microbiol Lett. 2012; 337: 120–125. https://doi.org/10.1111/1574-6968.12015
32. Brodkorb A, Egger L, Alminger M, Alvito P, Assunção R, Ballance S, Bohn T, Bourlieu-Lacanal C, Boutrou R, Carrière F, et al. INFOGEST static in vitro simulation of gastrointestinal food digestion. Nat Protoc. 2019; 14: 991–1014. https://doi.org/10.1038/s41596-018-0119-1
33. Virtanen P, Gommers R, Oliphant TE, Haberland M, Reddy T, Cournapeau D, Burovski E, Peterson P, Weckesser W, Bright J, et al. SciPy 1.0: fundamental algorithms for scientific computing in Python. Nat Methods. 2020; 17: 261–272. https://doi.org/10.1038/s41592-019-0686-2
34. Ramdhan T, Ching SH, Prakash S, Bhandari B. Time dependent gelling properties of cuboid alginate gels made by external gelation method: effects of alginate-CaCl₂ solution ratios and pH. Food Hydrocoll. 2019; 90: 232–240. https://doi.org/10.1016/j.foodhyd.2018.12.022
35. Rayment P, Wright P, Hoad C, Ciampi E, Haydock D, Gowland P, Butler MF. Investigation of alginate beads for gastro-intestinal functionality, part 1: in vitro characterisation. Food Hydrocoll. 2009; 23: 816–822. https://doi.org/10.1016/j.foodhyd.2008.04.011
- Abstract Viewed: 0 times
- Pdf Downloaded: 0 times