
Assessment of the Amino Acid Composition of Shubat from Western Kazakhstan
Applied Food Biotechnology,
Vol. 12 No. 1 (2025),
4 Dey 2025
,
Page 1-9 (e28)
https://doi.org/10.22037/afb.v12i1.50507
Abstract
Background and Objective: Fermented foods of camel milk are important components of the diet for people living in arid lands. Shubat is a widely consumed fermented camel milk product in Kazakhstan. However, a comprehensive assessment of its protein quality, specifically amino acid composition, is lacking. This study aimed to assess biological value of the protein component of traditionally prepared shubat from Western Kazakhstan.
Material and Methods: Totally, 12 shubat samples were collected from the regions of Atyrau, Aktobe, Mangystau and West Kazakhstan. All samples were set to the national standard ST RK 117-2015. Amino acid composition was assessed using high-performance liquid chromatography with pre-column derivatization. The biological value was assessed by calculating the essential amino acid content; then, amino acid score was compared to the Food and Agriculture Organization/World Health Organization (2011) reference score and the amino acid composition index (UA) based on Harrington's desirability scale. Data were present as mean ± standard deviation (n = 3).
Results and Conclusion: Significant regional variance was observed. Fat and protein contents varied from 5.47 to 6.69% and from 2.14 to 3.21%, respectively. The essential amino acid content constituted 43–46% of total amino acids. The presence of limiting amino acids was a key factor reducing the protein quality. The first limiting amino acid was histidine in samples from Atyrau and West Kazakhstan and leucine in samples from Aktobe and Mangystau. The identification of these region-specific limiting amino acids highlights potential nutritional considerations for populations relying on shubat as a primary protein source. The amino acid composition index (UA) was highest for the sample from Mangystau (0.66) rated as "good," while samples from other regions were rated "satisfactory" (0.56–0.58).
Keywords: Amino acid composition index (UA), Amino acid score, Biological value (BV), Camel milk, Chemical compositionm Essential amino acids (EAAs), Fermented foods, Protein content.
Introduction
Camel milk is an essential component of the diet in arid and semi-arid regions where other livestock are less resilient to extreme climatic conditions, serving as a vital nutritional source for populations in these areas [1]. In recent years, an increasing global interest in camel milk as an alternative to other types of milk is reported due to its hypoallergenic, anti-carcinogenic and anti-diabetic characteristics [2,3,4]. Camel milk contains significant quantities of bioactive compounds such as lactoferrin, immunoglobulins, lysozyme and vitamin C, which contribute to immune support and prevention of non-communicable diseases [5,6]. The milk unique biochemical characteristics are largely attributed to its protein composition, particularly low content of β-casein and absence of β-lactoglobulin, making it appropriate for individuals with milk allergies [7,8]. Despite these advantages, there is a limited research on the detailed composition of camel milk and its fermented derivatives, especially regarding their nutritional potential and use in the food industry [9,10,11]. One of the most effective ways to enhance the nutritional and functional value of milk is through fermentation, a process that improves digestibility and enriches the product with bioactive compounds [12,13]. Fermented dairy products differ across the world for production methods, microbial cultures and names, including yogurt, kefir, matsoni, dahi, ghioddu, leben, tarag, unda, shubat (chal), suusak (susa) and garris [14,15,16].
Shubat (chal), a traditional fermented camel milk beverage, is widely consumed in Turkey, Turkmenistan and Kazakhstan, where it has historically been produced through spontaneous fermentation. Traditionally, shubat is prepared by mixing fresh camel milk with warm water (1:1 ratio) in goatskin or ceramic containers and inoculating it with 1/3–1/5 of previously fermented milk as a starter culture. The fermentation typically lasts 3–4 h at 25–30 °C, followed by an additional maturation phase of nearly 8 h at a similar temperature, promoting mixed lactic and alcoholic fermentation [17,18]. In modern Kazakhstan, shubat is manufactured on an industrial scale using defined starter cultures such as Lactobacillus casei and Streptococcus thermophiles with yeasts [19]. Under industrial conditions, camel milk fermentation occurs at 25 °C for approximately 8 h, followed by incubation at 20 °C for nearly 16 h. The final product must meet the quality and safety criteria established by the National Standard of the Republic of Kazakhstan (ST RK 117-2015 “Shubat. General Technical Conditions”) and relevant international guidelines [20].
Studies of the amino acid (AA) composition of camel milk indicate the presence of 17 AAs, excluding tryptophan, with essential amino acids (EAAs) comprising approximately 43.5–43.9% of total amino acids (TAAs), values that exceed the Food and Agriculture Organization/World Health Organization (FAO/WHO) recommended standards. The ratios of EAAs/TAAs and EAAs/NEAAs (non-essential amino acids) are greater than 40 and 75%, respectively [21]. Furthermore, fermentation significantly affects the protein profile of camel milk, increasing the content of antioxidant peptides, likely due to the unique structure of β-casein, which is shorter and richer in proline residues. Hydrolysis of β-casein leads to the release of bioactive peptides and AAs such as phenylalanine and tryptophan with antioxidant activity [22]. Regarding limited data on the biochemical characteristics of fermented camel milk products, this study aimed to assess the biological value of the protein fraction of shubat from the western regions of the Republic of Kazakhstan, focusing on EAA profiles. The assessment was based on the AA score, AA composition index (UA) and Harrington’s desirability scale to provide a comparative assessment of nutritional quality in regional samples [23].
- Materials and Methods
2.1. Samples collection
Totally, 12 samples of traditionally prepared fermented product, shubat, were selected from western regions of the Republic of Kazakhstan, where Bactrian camels were widely bred (Atyrau, Aktobe and Mangystau, West Kazakhstan). Samples were collected randomly from local markets and households in each region, representing the traditional supply chain. As shubat was a traditionally fermented product, specific data on camel breed, lactation stage and feed were not controlled, reflecting the typical consumption product. This initial survey of 12 samples (four per region) provided a foundational mapping of the AA profile across Western Kazakhstan. The samples (250 ml each) were collected in sterile screw-cap bottles and stored at low refrigeration temperature (4 ±2 °C) until use.
All samples were positively assessed for quality and safety indicators based on ST RK 117-2015 “Shubat. General Technical Conditions” and Technical Regulations of the Customs Union - TR CU 033/2013 “On the Safety of Milk and Dairy Products” and approved for further research [24,25].
2.2. Amino Acid Composition Analysis
Assessment of the AA composition of the samples was carried out using high-performance liquid chromatography (HPLC) and an Agilent 1200 liquid chromatograph device, USA, with diode-array detection at 254 nm [26]. Prior to analysis, proteins were hydrolyzed with 6M HCl for 24 h at 110 °C under a nitrogen atmosphere. Tryptophan was analyzed after alkaline hydrolysis. The hydrolysates were derived using AccQ-Tag reagent kit (Waters, USA) according to the manufacturer's instructions. A C18 column was used at the column thermostat temperature of 16 °C. Acetonitrile and acetate buffer at pH 6.0 were used as the mobile phase in a gradient elution mode with flow rate of 1.0 ml min-1 [27]. Qualitative and quantitative analyses were carried out based on retention time and the internal standard method (norvaline was used as an internal standard). Calibration was carried out using standard AA mixture (Sigma-Aldrich, USA). All analyses were carried out in triplicate (n = 3) [28].
In this study, standard samples of proteinogenic AAs were used, including aspartic acid (Asp), glutamic acid (Glu), serine (Ser), histidine (His), glycine (Gly), threonine (Thr), arginine (Arg), alanine (Ala), proline (Pro), tyrosine (Tyr), valine (Val), methionine (Met), isoleucine (Ile), leucine (Leu), tryptophan (Trp), phenylalanine (Phe) and lysine (Lys). These AAs are major structural elements for protein biosynthesis and characterized by unique physicochemical parameters that set their functional characteristics in biological systems. Ratio of EAA to NEAA was calculated mathematically.
2.3. Assessment of Amino Acid Composition
The EAA content was calculated to g per 100 g of protein using Formula 1:
Where, A was the mass fraction of an EAA in a sample, g per 100 g of sample; and B was the mass fraction of protein in a sample, g. To calculate the AA score, the content of each EAA of a sample was compared with its content in the reference protein (FAO/WHO, 2011) using Formula 2
Where, Ai was the mass fraction of an EAA of a sample, g per 100 g of protein; and Ari was the mass fraction of an EAA in the reference protein, g per 100g of protein. An AA score rate of less than 100% was addressed as “limiting”. In a presence of several limiting AAs in a sample, an AA with the lowest AA score was addressed as “first limiting”. Assessment of the biological value of the protein component was carried out using an AA composition index (UA) based on Liebig’s law (Formula 3):
Where, m was the quantity of EAAs based on FAO/WHO, 2011 (nine EAAs). The inversion in the formula for , when ensured that any deviation from the ideal reference protein, whether a deficit or an excess, negatively affected the index. This was because an excess of one EAA could not compensate for a deficit in another (the "law of the minimum"). To analyze data, Harrington’s function known as the desirability scale was used. The desirability scale was divided in several ranges from 0 to 1 by five subranges of [0–0.2] "very bad", [0.2–0.37] "bad", [0.37–0.63] "satisfactory", [0.63–0.8] "good" and [0.8–1] "very good".
2.4. Statistical Analysis
All measurements were carried out in triplicate and results were expressed as mean ±SD (standard deviation). Differences in chemical composition and AA content between the regions were assessed using one-way analysis of variance (ANOVA) followed by Tukey's post-hoc test for multiple comparisons and SPSS software v.26 (IBM, USA). A p-value less than 0.05 was considered statistically significant.
- Results and Discussion
Chemical composition of the samples was assessed based on the requirements of ST RK 117-2015 “Shubat. General Technical Conditions”, where protein content is not standardized. Results of this assessment are present in Table 1. Literary, data report on chemical composition of camel milk in the Republic of Kazakhstan highlights its fat content in a range from 4.47 to 5.17, as well as total protein content from 3.5 to 4.45 [29]. Increase in fat content and decrease in total protein in the samples were recorded, previously described by the global research community [30]. The present study showed that all samples exceeded the established indicators of ST RK 117-2015, in particular, the minimum requirements for fat content by 1.5–2 times (Table 1).
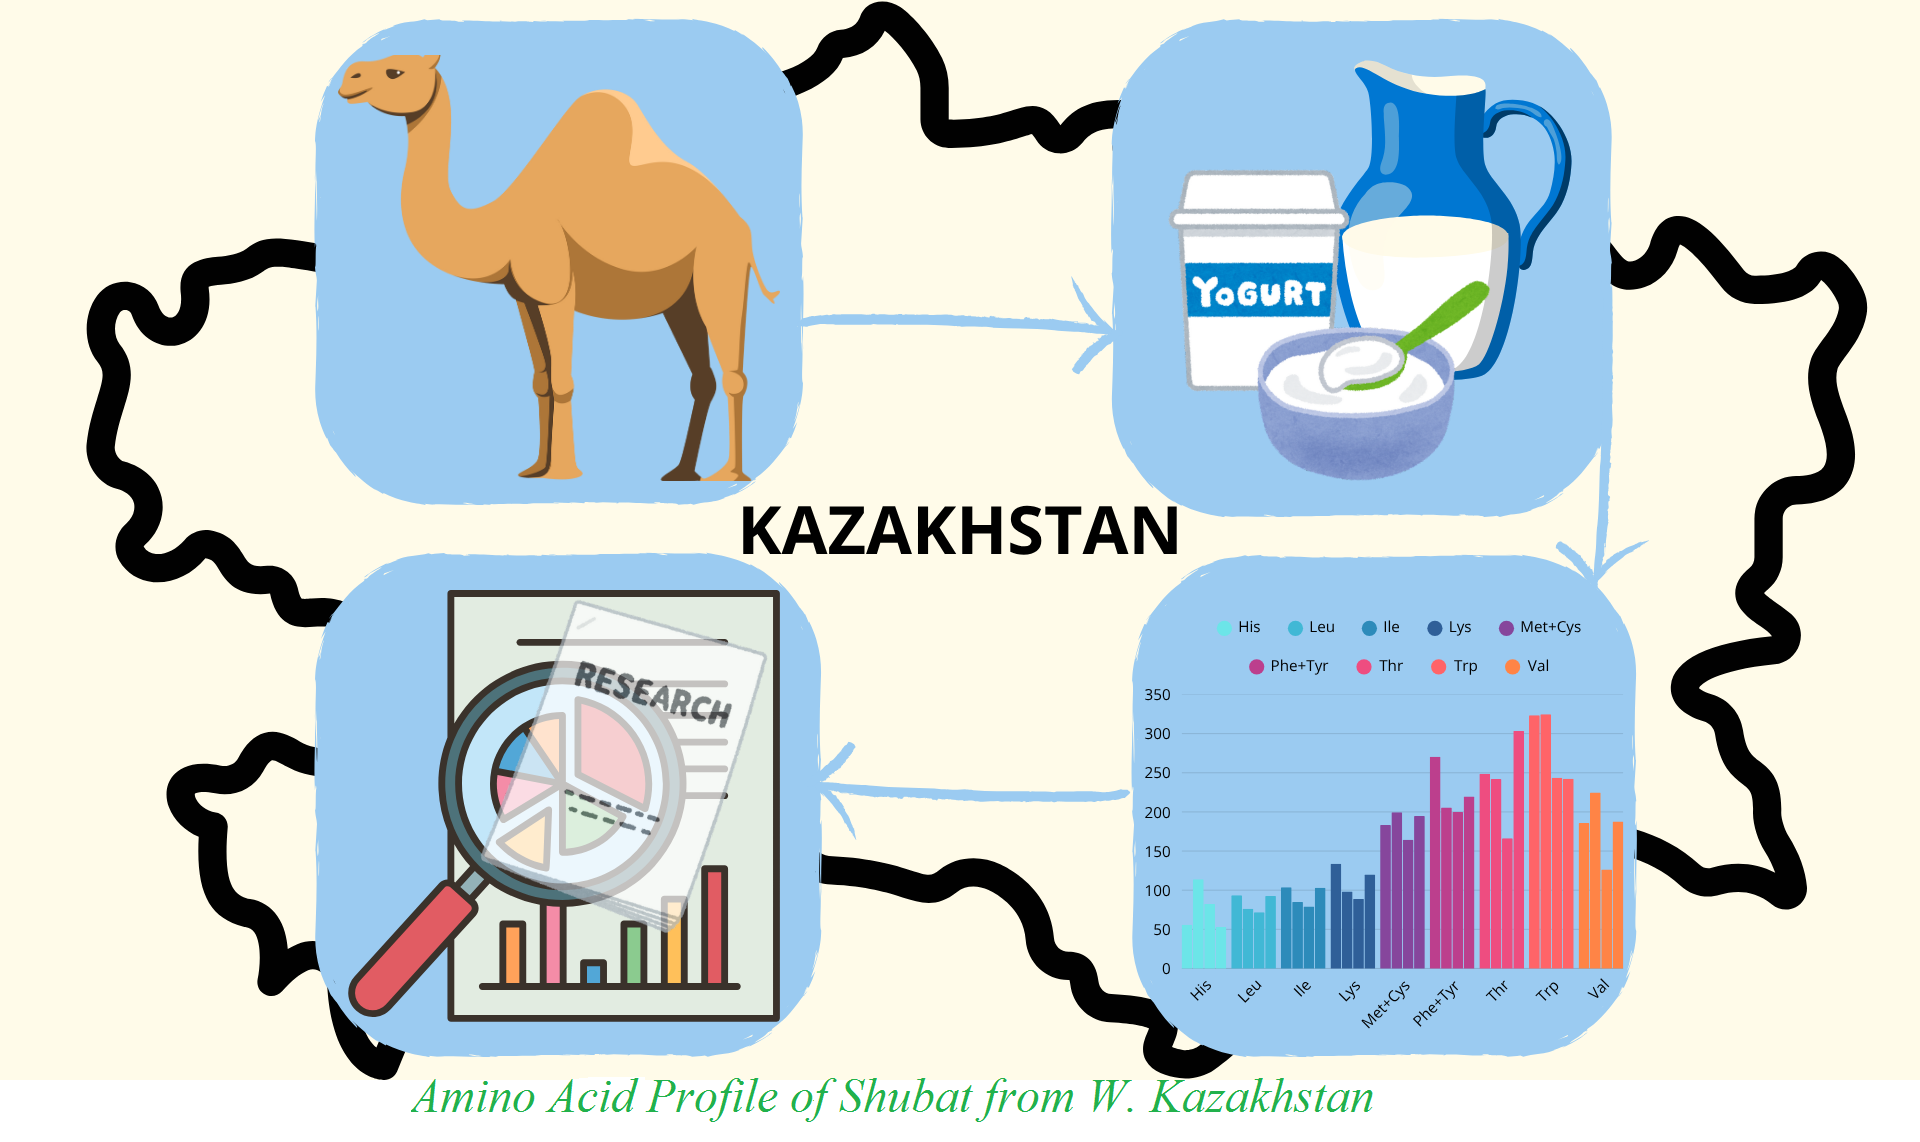
Initial data on the AA composition of samples, focusing on EAAs, were present in g per 100 g of sample (Figure 2 and Table 2). A variety was revealed in the AA composition of samples, which might be due to the differences in their chemical composition. It should be stated that the proportion of EAAs was 43–46%, similar to that reported in the global data [31,32,33].
Figure 3 presents a comparative analysis of the biological value of protein component in the samples using AA score method based on the reference protein data (FAO/WHO, 2011) [35].
To assess biological value of the protein component of samples, AA composition data were recalculated based on the units of the reference protein (FAO/WHO) in g per 100 g of protein (Table 3) [34].
In addition, biological value of the protein component of samples was assessed using AA composition index (UA) and summarized data based on Harrington’s desirability function [36,37]. The calculation results are present in Table 4.
Based on this study, it could be concluded that all samples of shubat from the Western Kazakhstan regions met the requirements of regulatory framework of the Republic of Kazakhstan in accordance with ST RK 117-2015 "Shubat. General Technical Conditions" and significantly exceeded the minimum requirements for fat content. Specifically, the highest value of this value was observed in the sample from Atyrau (6.69%) and the lowest in a sample from West Kazakhstan (5.47%). Moreover, the highest value for protein content was reported in a sample from West Kazakhstan (3.21%), slightly a lower protein content in a sample from Mangystau (3.04%), significantly a lower protein content in a sample from Aktobe (2.32%) and the lowest value in a sample from Atyrau (2.14%). For lactose and ash in the samples, a relatively identical content of dry matter of nearly 13–14% was recorded, which corresponded to the literary data by other authors [38,39].
Assessment of the biological value of protein component in the samples using AA score method and AA composition index (UA) showed that all the samples included satisfactory values. However, statistically significant variability in AA composition of samples was seen, which might be due to various chemical composition of the camel milk from the western regions of the country, affected by factors such as biodiversity of the forage base, regional environmental conditions and traditional husbandry practices.
A negative factor in assessing biological values of the protein component of the samples was the presence of limiting AAs such as leucine, an AA score of which varied from 71.8 to 93.5% and histidine, an AA score of which varied from 53 to 82.5% (with the exception of a sample from Aktobe with a score of 114%), as well as isoleucine and lysine for samples from Aktobe and Mangystau (AA scores of isoleucine were 85 and 79.1% and those of lysine were 98.2 and 88.9%, respectively). This imbalance was demonstrated by the UA index, which penalized deficits and excesses. However, increased values of EAAs were reported in the samples. In particular, phenylalanine and tyrosine exceeded the FAO/WHO 2011 values by an average of two times and tryptophan by 2–3 times, which negatively affected comprehensive assessment of the highlighted parameters.
It should be stated that in samples from Atyrau and West Kazakhstan, the first limiting AA was histidine, with AA scores of 56 and 53%, respectively. Histidine is critical for protein synthesis, tissue repair and production of histamine. Deficiency of this AA can impair growth in children and negatively affect metabolic functions [40,41]. This factor may lead to disruptions in numerous physiological processes such as impaired protein synthesis and decreased muscle mass, slower metabolism and decreased energy exchange in the human body [42,43]. In samples from Aktobe and Mangystau, deficiency of leucine was observed, with AA scores of 76.4 and 71.8%, respectively. Leucine is a key regulator of muscle protein synthesis and metabolic signaling pathways [44,45]. This might negatively affect immunity and overall metabolism and lead to the following adverse consequences of impaired functioning of the nervous and hematopoietic systems, decreased antioxidant protection and weakened immune function of the body [46,47].
Compared to other fermented camel milks such as chal from Turkmenistan [48], EAA profile of the shubat samples showed high phenylalanine and tyrosine values as well as its specific limiting AAs, which might be attributed to the differences in camel breed, fermentation microbiota and/or regional diets. Based on the data (Table 4), it could be concluded that samples from western regions of the Republic of Kazakhstan such as Atyrau, West Kazakhstan and Aktobe, included similar AA composition index (UA) values ranging from 0.56 to 0.58, assessed as “satisfactory” based on Harrington’s desirability function. A sample from Mangystau demonstrated the highest AA composition index (UA) value (0.66), which was characterized as “good” based on Harrington’s desirability scale.
- Conclusion
This study provided the first comprehensive assessment of the AA composition and protein quality of traditionally prepared shubat from Western Kazakhstan. Results showed that although shubat was a rich source of fat and contained a substantial proportion of EAAs (43–46%); its protein quality was limited by region-specific deficiencies in histidine and leucine, leading to an overall "satisfactory" to "good" rating on the Harrington scale. It is necessary to expand a number of studied samples from other regions of the Republic of Kazakhstan as well as focus on studying chemical composition of the raw materials for shubat production (camel milk from similar regions) to identify correlations between the low EAA values in samples due to deficiencies in individual AAs in the raw materials. Furthermore, when studying qualitative composition of the raw material protein component, attention should be paid to seasonality of the camel milk production. Effect of the biodiversity of forage base and conditions, under which camels are bred in various regions of the Republic of Kazakhstan, should be addressed. Further studies should specifically aim to (1) link shubat composition with raw camel milk from similar regions and seasons; (2) investigate effects of specific fermentation strains on the release of bioactive peptides and the AA profile; and (3) carry out longitudinal monitoring of temporal variations in milk composition. Identification of the specific limiting AAs provides a scientific basis for the potential fortification strategies to enhance the nutritional completeness of shubat in public health initiatives.
- Acknowledgements
This research has been funded by the Science Committee of the Ministry of Education and Science, Republic of Kazakhstan (grant no. AP23490202).
- Declaration of competing interest
The authors report no conflict of interest.
- Authors’ Contributions
Conceptualization, L.N. and A.O.; methodology, L.N. and R.M.; formal analysis, B.R. and R.M.; investigation, B.R. and A.O.; data curation, R.M.; writing-original draft preparation, B.R. and L.N.; writing-review and editing, L.N. and A.O.; visualization, A.O.; supervision, L.N.; project administration, A.O.; funding acquisition, A.O. All authors have read and agreed to the published version of the manuscript.
- Using Artificial Intelligent Chatbots
During preparation of this manuscript, the authors used ChatGPT (OpenAI) to improve language clarity and readability. After using this tool, the authors reviewed and edited the content as needed and accepted full responsibility for the content of the publication.
- Amino acid composition index
- Amino acid score
- Biological value
- Camel milk
- Chemical compositionm Essential amino acids
- Fermented foods
- Protein content
How to Cite
References
References
1. Orazov A, Nadtochii L, Bozymov K, Muradova M, Zhumayeva A. Role of camel husbandry in food security of the Republic of Kazakhstan. Agriculture. 2021; 11(7): 614. https://doi.org/10.3390/agriculture11070614
2. Agrawal RP, Jain S, Shah S, Chopra A, Agarwal V. Effect of camel milk on glycemic control and insulin requirement in patients with type 1 diabetes: 2-years randomized controlled trial. Eur J Clin Nutr. 2011; 65: 1048-1052. https://doi.org/10.1038/ejcn.2011.98
3. Magjeed NAA. Corrective effect of milk camel on some cancer biomarkers in blood of rats intoxicated with aflatoxin B1. J Saudi Chem Soc. 2009; 9(2): 253-263. https://eurekamag.com/research/004/089/004089746.php
4. Shabo Y, Barzel R, Margoulis M, Yagil R. Camel milk for food allergies in children. Isr Med Assoc J. 2005; 7: 796-798. https://pubmed.ncbi.nlm.nih.gov/16382703/
5. Konuspayeva G, Faye B, Loiseau G, Levieux D. Lactoferrin and immunoglobulin contents in camel’s milk (Camelus bactrianus, Camelus dromedarius and Hybrids) from Kazakhstan. J Dairy Sci. 2007; 90(1): 38-46. https://doi.org/10.3168/jds.s0022-0302(07)72606-1
6. Elagamy EI, Ruppanner R, Ismail A, Champagne CP, Assaf R. Purification and characterization of lactoferrin, lactoperoxidase, lysozyme and immunoglobulins from camel’s milk. Int Dairy J. 1996; 6(2): 129-145. https://doi.org/10.1016/0958-6946(94)00055-7
7. Kaskous S. Importance of camel milk for human health. Emir J Food Agr. 2016; 28(3): 158-163. https://doi.org/10.9755/ejfa.2015-05-296
8. Yadav AK, Kumar R, Priyadarshini L, Singh J. Composition and medicinal properties of camel milk: A Review. Asian J Dairy Food Res. 2015; 34(2): 83-91. https://doi.org/10.5958/0976-0563.2015.00018.4
9. Farah Z. Composition and characteristics of camel milk. J Dairy Res. 1993; 60(4): 603-626. https://doi.org/10.1017/s0022029900027953
10. Sagyman Zh, Xiao H, Anapiyayev BB, Tao F, Xu P. Bacterial diversity analysis in Kazakh fermented milks Shubat and Ayran by combining culture-dependent and culture-independent methods. LWT. 2021; 141: 110877. https://doi.org/10.1016/j.lwt.2021.110877
11. Nadtochii L, Orazov A, Muradova M, Bozymov K, Japarova A, Baranenko D. Comparison of the energy efficiency of production of camel’s and cow’s milk resources. Energy Procedia. 2018; 147: 510-517. https://doi.org/10.1016/j.egypro.2018.07.064
12. Abdelrahim A, Bahobail AA. Effect of fermentation process on the improvement of nutrition value of camel milk. Int J Multidiscip Curr Res. 2014; 2: 78-82. https://ijmcr.com/wp-content/uploads/2014/01/Paper1278-82.pdf
13. Hamed NSh, Mbye M, Ayyash M, Ulusoy BH, Kamal-Eldin A. Camel milk: Antimicrobial agents, fermented products and shelf life. Foods. 2024; 13(3): 381. https://doi.org/10.3390/foods13030381
14. Lore TA, Mbugua SK, Wangoh J. Enumeration and identification of microflora in suusac, a Kenyan traditional fermented camel milk product. LWT - Food Sci Technol. 2005; 38(2): 125-130. https://doi.org/10.1016/j.lwt.2004.05.008
15. Khomeiri M, Yam BAZ, Mahounak AS, Jafari SM. Hygienic quality of camel milk and fermented camel milk (Chal) in Golestan Province, Iran. J Microbiol Res. 2014; 4(2): 98-103. https://doi:10.5923/j.microbiology.20140402.09
16. Sulieman AME, Osawa R, Tsenkova R. Isolation and identification of lactobacilli from Garris, a sudanese fermented camel’s milk product. Res J Microbiol. 2007; 2: 125-132. https://scialert.net/abstract/?doi=jm.2007.125.132
17. Bilal Z, Akhmetsadykova Sh, Baubekova A, Tormo H, Faye B, Konuspayeva G. The main features and microbiota diversity of fermented camel milk. Foods. 2024; 13(13): 1985. https://doi.org/10.3390/foods13131985
18. Fallah Z, Feizi A, Hashemipour M, Kelishadi R. Effect of fermented camel milk on glucose metabolism, insulin resistance and inflammatory biomarkers of adolescents with metabolic syndrome: A double-blind, randomized, crossover trial. J Res Med Sci. 2018; 23(1): 32. https://doi.org/10.4103/jrms.JRMS_1191_17
19. Akhmetsadykova Sh, Baubekova A, Konuspayeva G, Akhmetsadykov N, Loiseau G. Microflora identification of fresh and fermented camel milk from Kazakhstan. Emir J Food Agric. 2014; 26(4): 327-332. https://doi.org/10.9755/ejfa.v26i4.17641
20. National Standard of the Republic of Kazakhstan (ST RK) 117-2015 “Shubat. General technical conditions” (in Kazakh). Available from: https://files.stroyinf.ru/Data2/1/4293740/4293740691.pdf
21. Seyiti Sh, Kelimu A, Yusufu G. Bactrian camel milk: Chemical composition, bioactivities, processing techniques and economic potential in China. Molecules. 2024; 29(19): 4680. https://doi.org/10.3390/molecules29194680
22. Swelum AA, El-Saadony MT, Abdo M, Ombarak RA, Hussein EOS, Suliman G, Alhimaidi AR, Ammari AA, Ba-Awadh H, Taha AE, El-Tarabily KhA, El-Hack AME. Nutritional, antimicrobial and medicinal properties of Camel’s milk: A review. Saudi J Biol Sci. 2021; 28(5): 3126-3136. https://doi.org/10.1016/j.sjbs.2021.02.057
23. Orazov A, Abbasbeigi S, Koishiyeva Zh, Nadtochii L. Assessment of milk-based high protein products as ingredients of low-fat ice creams. Appl Food Biotechnol. 2024; 11(1): e34. https://doi.org/10.22037/afb.v11i1.46380
24. Technical Regulations of the Customs Union (TR CU) 033/2013 “On the Safety of Milk and Dairy Products” (in Russian). Available from: https://eacgroupcompany.com/en/regulations/trcu033-2013
25. FAO and WHO. 2024. Standard for fermented milks. Codex Alimentarius Standard No. CXS 243-2003. Codex Alimentarius Commission. Available from: https://www.alcpo.org.ly/wp-content/uploads/2017/06/CODEX-STANDARD-FOR-FERMENTED-MILKS.pdf
26. Lebedev AT. Environmental mass spectrometry. Annu Rev Anal Chem. 2013; 6:163-189. https://doi.org/10.1146/annurev-anchem-062012-092604
27. Rebane R, Oldekop M, Herodes K. Comparison of amino acid derivatization reagents for LC–ESI-MS analysis. Introducing a novel phosphazene-based derivatization reagent. J Chromatogr B. 2012; 904: 99-106. https://doi.org/10.1016/j.jchromb.2012.07.029
28. Bosch L, Alegría A, Farré R. Application of the 6-aminoquinolyl-N-hydroxysccinimidyl carbamate (AQC) reagent to the RP-HPLC determination of amino acids in infant foods. J of Chromatogr B. 2006; 831(1-2): 176-183. https://doi.org/10.1016/j.jchromb.2005.12.002
29. Yoganandi J, Mehta BM, Wadhwani KN, Darji VB, Aparnathi KD. Evaluation and comparison of camel milk with cow milk and buffalo milk for gross composition. J Camel Pract Res. 2014; 21(2): 259-265. http://dx.doi.org/10.5958/2277-8934.2014.00046.0
30. Konuspayeva G, Faye B, Loiseau G. The composition of camel milk: A meta-analysis of the literature data. J Food Compos Anal. 2009; 22(2): 95-101. https://doi.org/10.1016/j.jfca.2008.09.008
31. Lee WTK, Weisell R, Albert J, Tomé D, Kurpad AV, Uauy R. Research approaches and methods for evaluating the protein quality of human foods proposed by an fao expert working group in 2014. J Nutr. 2016; 146(5): 929-932. https://doi.org/10.3945/jn.115.222109
32. Mathai JK, Liu Y, Stein HH. Values for digestible indispensable amino acid scores (DIAAS) for some dairy and plant proteins may better describe protein quality than values calculated using the concept for protein digestibility-corrected amino acid scores (PDCAAS). Br J Nutr. 2017; 117(4): 490-499. https://doi.org/10.1017/s0007114517000125
33. Marinangeli CPF, House JD. Potential impact of the digestible indispensable amino acid score as a measure of protein quality on dietary regulations and health. Nutr Rev. 2017; 75(8): 658-667. https://doi.org/10.1093/nutrit/nux025
34. Moughan PJ, Lim WXJ. Digestible indispensable amino acid score (DIAAS): 10 years on. Front Nutr. 2024; 11: 1-13. https://doi.org/10.3389/fnut.2024.1389719
35. FAO. Dietary protein quality evaluation in human nutrition. Report of an FAO expert consultation. 2011, Auckland, New Zealand. Available from: https://pubmed.ncbi.nlm.nih.gov/26369006/
36. Nadtochii L, Proskura A, Muradova M. 2021. Science-based design for foods composition: Teaching aid (in Russian). St. Petersburg: ITMO University. Available from: https://books.ifmo.ru/book/2571/nauchno-obosnovannoe_proektirovanie_pischevyh_kompoziciy_%3D_Science-based_design_for_foods_composition%3A_uchebno-metodicheskoe_posobie._.htm?utm_source=chatgpt.com
37. Terskaya LA, Slesarchuk IA. Harrington desirability function for multi-attribute outdoor space quality assessment. IOP Conf. Series: Materials Science and Engineering. 2020; 753: 1-6. https://doi.org/10.1088/1757-899X/753/8/082030
38. Phoa FKH, Chen H. Desirability function approach on the optimization of multiple bernoulli-distributed response. In: Proceedings of the 2nd International Conference on Pattern Recognition Applications and Methods. 2013; 1: 127-131. https://doi.org/10.5220/0004216701270131
39. Hailu Y, Hansen EB, Seifu E, Eshetu M, Ipsen R, Kappeler S. Functional and technological properties of camel milk proteins: A review. J Dairy Res. 2016; 83(4): 422-429. https://doi.org/10.1017/s0022029916000686
40. Kriengsinyos W, Rafii M, Wykes LJ, Ball RO, Pencharz PB. Long-term effects of histidine depletion on whole-body protein metabolism in healthy adults. J Nutr. 2002; 132(11): 3340-3348. https://doi.org/10.1093/jn/132.11.3340
41. Moro J, Tomé D, Schmidely Ph, Demersay T, Azzout-Marniche D. Histidine: A Systematic review on metabolism and physiological effects in human and different animal species. Nutrients. 2020; 12(5): 1414. https://doi.org/10.3390/nu12051414
42. DiNicolantonio JJ, McCarty MF, OKeefe JH. Role of dietary histidine in the prevention of obesity and metabolic syndrome. Open Heart. 2018; 5(2): e000676. https://doi.org/10.1136/openhrt-2017-000676
43. Giesecke K, Magnusson I, Ahlberg M, Hagenfeldt L, Wahren J. Protein and amino acid metabolism during early starvation as reflected by excretion of urea and methylhistidines. Metabolism.1989; 38(12): 1196-1200. https://doi.org/10.1016/0026-0495(89)90159-5
44. Szwiega S, Xu L, Rafii M, Pencharz PB, Kong D, Tomlinson Ch, Elango R, Courtney-Martin G. Protein intake affects erythrocyte glutathione synthesis in young healthy adults in a repeated-measures trial. Am J Clin Nutr. 2024; 119(2): 371-383. https://doi.org/10.1016/j.ajcnut.2023.11.008
45. Paoletti A, Courtney-Martin G, Elango R. Determining amino acid requirements in humans. Front Nutr. 2024; 11: 1-6. https://doi.org/10.3389/fnut.2024.1400719
46. Szwiega S, Pencharz PB, Ball RO, Xu L, Kong D, Elango R, Courtney-Martin G. Length of adaptation has no effect on the threonine requirement determined in healthy young adult males using the indicator amino acid oxidation method. J Nutr. 2023; 153(7): 2016-2026. https://doi.org/10.1016/j.tjnut.2023.03.033
47. Kurpad AV, Regan MM, Raj T, Gnanou JV. Branched-chain amino acid requirements in healthy adult human subjects. J Nutr. 2006; 136(1): 256S-263S. https://doi.org/10.1093/jn/136.1.256s
48. Seifu E. Camel milk products: Innovations, limitations and opportunities. Food Prod Process Nutr. 2023; 5(15): 1-20. https://doi.org/10.1186/s43014-023-00130-7
- Abstract Viewed: 402 times
- pdf Downloaded: 184 times